As with any currency pair, there are an abundance of factors to consider when trying to forecast price. Those factors can be broken down into technical factors and fundamental factors. On the technical side, price action is paramount. However, for USD/CAD, one must also include the correlation between USD/CAD and crude oil when considering price movement. Crude oil is a key export for the Canadian economy; therefore, it is important that we also consider the price movement of USD/CAD.
USD/CAD
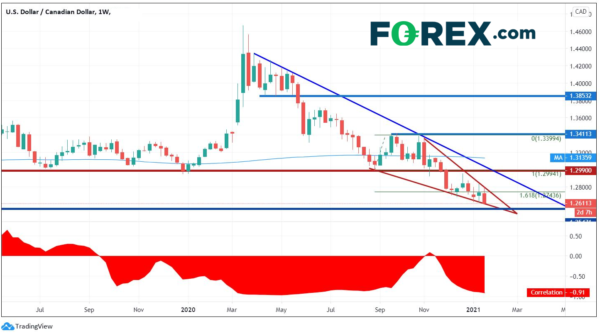
On a weekly timeframe, USD/CAD has been moving lower since its pandemic highs at 1.4667 in March 2020. The downtrend is still intact; however, the pair may be ready for a bounce. Since late September 2020, USD/CAD has been forming a descending wedge, and is currently nearing the apex. A descending wedge would suggest a breakout to the topside, with the target being a complete 100% retracement of the wedge, near 1.3410. In addition, price is hovering around the support area of the 161.8% Fibonacci extension from the lows during the week of August 31st to the highs during the week of September 21st.
Source: Tradingview, FOREX.com
The trend is still lower, however if USD/CAD breaks higher out of the descending wedge, there will be strong resistance on its way back to target. A downward sloping trendline and horizontal resistance converge near 1.2990 and the 200 Week moving average crosses at 1.3136. Major support isn’t until 1.2061, however this is horizontal support below near 1.2547.
Also notice the correlation coefficient at the bottom of the chart. Dating back to late 2018, most of the time crude oil and USD/CAD have had a negative correlation, meaning the 2 assets have been moving in opposite directions. (This means that the Canadian Dollar and Crude Oil prices have been moving in the same direction.) The current correlation coefficient is -0.91. For reference, a correlation coefficient of -1.00 means that the 2 assets are perfectly correlated and move in opposite directions on a one to one basis 100% of the time. The current correlation coefficient of -0.91 indicates a strong negative correlation!
WTI
As mentioned, its important to look at crude oil when discussing the Canadian Dollar. West Texas Oil (WTI) is right in the middle of a strong resistance zone between 50.50 and 54.40. This area has acted an important “decision zone” for traders dating back to 2014. In addition, the 61.8% Fibonacci retracement from the week of October 2018 highs to the March 2020 lows crosses just below at 51.86. The 200-week moving average also crosses in this zone near 52.96. Just above, there is a downward sloping trendline from the October 2018 highs, which crosses near 57.00. And although the RSI is not in overbought conditions yet, its pretty close at 68.81.
Source: Tradingview, FOREX.com
Given the strong correlation between WTI and USD/CAD, IF this resistance zone can hold and WTI pulls back towards horizontal support at 47.20, then it could mean a weaker Canadian Dollar as well. Therefore, a weaker price on a weekly chart in crude oil would suggest a stronger USD/CAD on the longer-term timeframe!
 Signal2forex.com - Best Forex robots and signals


