GBP/USD made a new higher high that hit the 1.3750 target as expected in my EU-GU video. But the uptrend seems to be struggling due to the reversal chart patterns.
On the 4 hour chart, price action did manage to break above the quadruple top. But the quick decline after the breakout is indicating a short lived bullish spike
The main target is the 233 ema and -61.8% Fibonacci target around the round 1.35 level. Either after an immediate breakout or small pullback.
Let’s review when to expect a potential bearish reversal. We also analyse what confirms a reversal and what invalidates it.
Price Charts and Technical Analysis
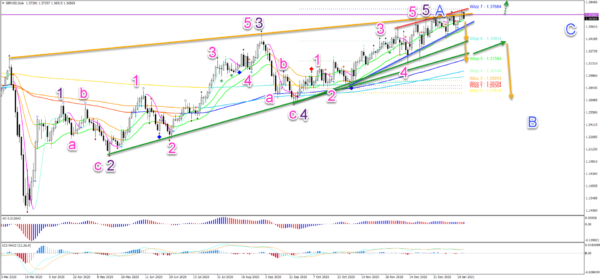
The GBP/USD is showing multiple reversal patterns and signs:
Building two separate rising wedge reversal chart patterns:
- a. A larger rising wedge (green and orange lines)
b. And a smaller rising wedge (blue and red lines) - Price action has also bounced at the Wizz 7 target zone
- GU is showing divergence patterns.
- Plus there seem to be 5 waves (pink) completed within wave 5 (purple).
All of these factors are increasing the chance of a larger bearish reversal (orange arrows). This remains valid unless price action breaks above the previous tops and goes above 1.37-1.3750 (dotted green arrow).
If bearish price swings do take place, then they could complete a wave B (blue). After that, we expect bullish price action once again to move up within wave C (blue).
… But the quick decline after the breakout is indicating a short lived bullish spike rather than a full uptrend continuation.
The main target is the 233 ema and -61.8% Fibonacci target around the round 1.35 level. Either after an immediate breakout or small pullback. But price action could fall even further down after a mild pullback at 1.35.
 Signal2forex.com - Best Forex robots and signals


