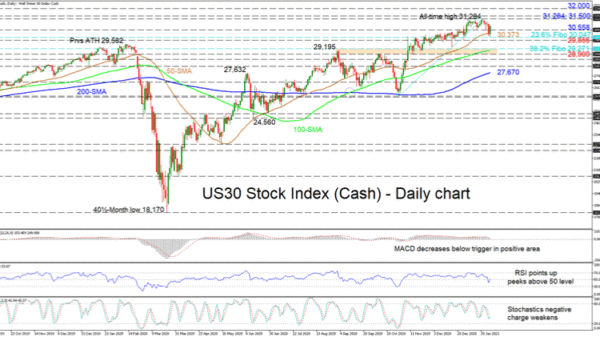
The US 30 stock index (Cash) has found footing on the 30,047 level, which happens to be the 23.6% Fibonacci retracement of the up leg from 26,065 until 31,284, after receding from its latest all-time high of 31,284. Yesterday’s losses saw the index pierce below the 50-day simple moving average (SMA), last encountered in early November of last year, to only recoup most of them today with a bounce off the 23.6% Fibo.
The rising SMAs are protecting the positive structure, while the short-term oscillators are suggesting sentiment is improving. The MACD, although has decreased below its red trigger line, is holding in bullish territory, while the RSI has sneaked above the 50 threshold. Negative momentum in the stochastic oscillator is stalling as the %K line has turned upwards, looking set for a positive crossover of the %D line.
If the index manages to close above the 50-day SMA at 30,373 and the 30,558 obstacle with its recently acquired positive traction off the 23.6% Fibo of 30,047, next resistance could occur with a revisit to the all-time high of 31,284. Resuming the broader ascent may then meet the 31,500 hurdle before further advances target the 32,000 round number.
Alternatively, if the price retreats below the 50-day SMA at 30,373, the support section, from the 23.6% Fibo of 30,047 until the 29,856 low, could test the decline for a second time. Should a deeper retraction be victorious, the price may encounter hardened support from the 38.2% Fibo of 29,271 until the 28,900 trough, a zone around the vicinity of the 100-day SMA.
Summarizing, the US 30 index remains relatively skewed to the upside above the SMAs and the 29,856-30,047 boundary.


 Signal2forex.com - Best Forex robots and signals


