Yesterday, we discussed where GBP could be headed next, given the unveil of the reopening plan for the UK economy. We also discussed how the BOE has become “less dovish” than other central banks. And we looked at how the GBP had broken through significant areas and may head higher, though we cautioned that there may be a pullback given the RSI readings in overbought territory.
Then…..a stop run occurred in quiet trading during Asian hours.
A stop run occurs when a trader, most likely big money, buys (sells) an asset, pushing it into new high (low) territory. If one can make a strategic guess as to where large stops are building in the market (ie above or below a phycological round number), a move to that price will trigger the stop losses and price will run higher (lower). This seems to be what happened earlier in GBP pairs in quiet, illiquid trading, during Asian hours. The Asian time zone is normally quiet, as many in Europe and the US are sleeping. Traders will put stop loss orders in the market, in case the market moves “too far away” from their entrance point while they are asleep. In addition, smaller traders who try and put on counter move positions near resistance will likely have their stops just above (below) key areas. It makes for a good risk/reward trade, but weak longs (shorts) will get carried out with the rest of the stops. The move in one currency pair that was hit (ie GBP/USD) will likely cause a ripple effect into similar pairs (ie other GBP pairs).
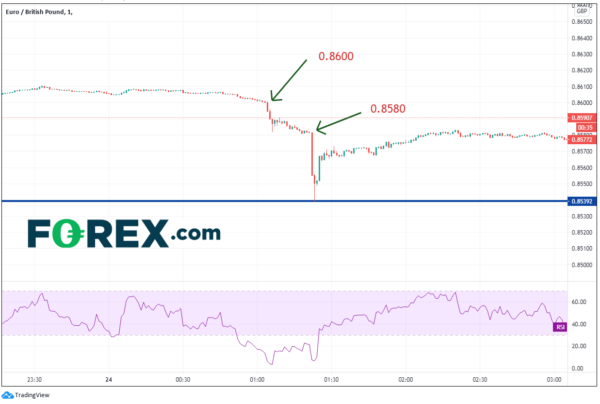
Without knowing which GBP stops were targeted, one can guess that it was EUR/GBP stops below 0.8600. given the phycological round number. Yesterday, we wrote “price is moving towards strong long-term horizontal support near 0.8600. The bounce is not out of the question as bears may look to take profits near these levels. The next level of horizontal support is near 0.8517.” As traders were aware of this level, stops were building underneath. The 0.8600 level failed to hold, and stops were taken out below.
On a 1-minute chart of EUR/GBP, price broke 0.8600 and fell aggressively to 0.8580. However, 10 minutes later, not happy with the number of stops taken out (and after algorithms jumped on board), they went after stops below 0.8580. That was it! In a span of 2 minutes, price traded from 0.8580 down to a low of 0.8539, clearing out all stops in the way.
Source: Tradingview, FOREX.com
Price then bounced over the next few hours back near the 0.8580/0.8600 level. In the short term (a few days), price may continue higher. IF price closes near current levels, a hammer candlestick will have formed on the daily timeframe (with a low near support), indicating a reversal may occur. The RSI is still extremely oversold, currently near 20.10. A bounce will give time for the indicator to move back into neutral territory.
Source: Tradingview, FOREX.com
On a 240-minute timeframe, horizontal resistance is near 0.8632 and 0.8677, ahead of the downward sloping, upper trendline of the channel near 0.8700. Support is at todays lows near 0.8529, then horizontal support near 0.8517.
Source: Tradingview, FOREX.com
One thing to note: often times when a spike has occurred, and price has reversed back to pre-spike level, price often “drifts” back towards the highs or lows of the spike. Watch for a move back to 0.8539 over the next few days and weeks.


 Signal2forex.com - Best Forex robots and signals


