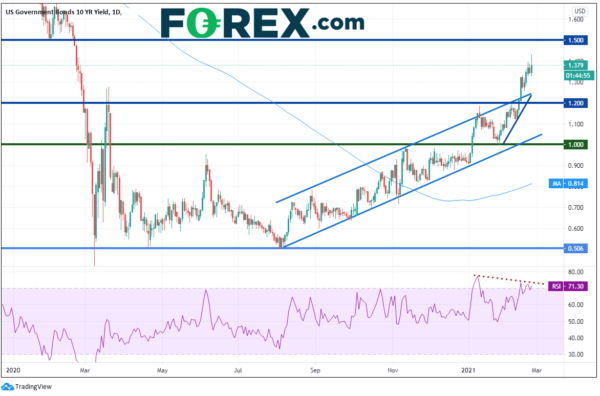
Things seem like they are back to normal, regardless of Jay Powell says: Higher stocks, higher yields, higher USD/JPY higher, higher Crude. They all seem to be acting in harmony with one another, just like the old days! With a dovish Powell, one would think the yields and commodities may be lower. Powell doesn’t think much of the inflation (or employment) right now, however, bond traders disagree. The 10-year yield reached its post pandemic higher today near 1.43%, its highest level since February 21st, 2020. Strong horizontal resistance confluences just above at the horizontal and phycological round number resistance of 1.50%! The RSI is also diverging, which indicates a pullback may be coming soon.
USD/JPY appears to be moving with yields since the beginning of the year. USD/JPY put in a low on January 5th, near 102.60 and has been trading higher since. The pair is currently nearing resistance at the 38.2% Fibonacci retracement from the February 20th, 2020 highs to the January 5th lows near 106.26. If price breaks above there, the 50% retracement level is at 107.39. Price sliced through the 200 Day Moving Average today, which now acts as first support at 105.49, then horizontal support at 104.92 and 104.41.
Even with a dovish RBNZ, NZD/USD screamed higher today, up 1.6%, trading right into horizontal resistance near 0.7440. NZD/USD had traded higher out of a pennant formation and the target is near 0.7880. However, the pair must first get through resistance at 2017 highs near 0.7555. The RSI for NZD/USD is also in overbought territory, indicating the pair may be ready to pull back as well. The New Zealand Dollar is highly correlated to copper, which also put in 10-year highs today!
Just for fun, with commodities, USD/JPY, and NZD/USD all higher, lets look at NZD/JPY. As you may guess, it was also higher, up over 2% on the day. The pair broke above the 50% retracement level from the late December 2014 highs to the March 2020 lows hear 76.97, as well as, horizontal resistance from December 2018 at 78.86. The next level of resistance is at the 61.8% Fibonacci retracement level of the same time period near 81.05! Support is back at an upward sloping trendline and todays lows near 77.07. Again, take note of the RSI reading above 80. Price may be ready for a pullback after such a large daily move.
Although everything seemed like the good old days today, be careful. As mentioned, a number of these instruments are nearing resistance and have RSI’s that are in overbought territory. A pullback may be ahead!


 Signal2forex.com - Best Forex robots and signals


