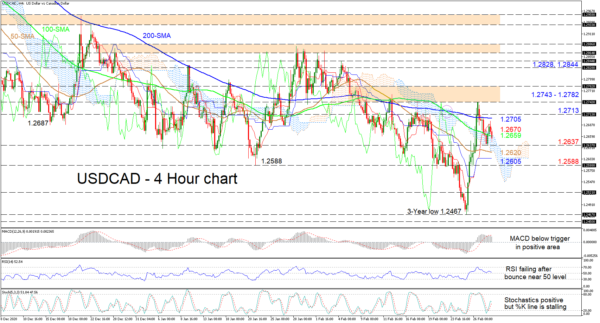
USDCAD is somewhat caught between the 200- and 50-period simple moving averages (SMAs) after the impressive rally from the 3-year low of 1.2467, pulled back under the 200-period SMA. The downturn in the red Tenkan-sen line together with the flattening blue Kijun-sen line are indicating fading in the positive drive, while the sliding SMAs are adding weight onto a deteriorating picture.
The short-term oscillators are also suggesting bullish momentum is dwindling. The MACD, above the zero mark, is dipping lower under its red trigger line, while the RSI is struggling to sustain its bounce higher, off the 50 level. Diminishing sentiment is also being endorsed within the stochastic oscillator by the ebbing of the %K line.
If the pair, which is pushing under the 100-period SMA, persists in logging lower highs and lower lows, initial downside limitations could come at the nearby trough of 1.2637. Diving deeper into the cloud, the 50-period SMA at 1.2620 – adjacent to the cloud’s lower surface – could provide support ahead of the hovering blue Kijun-sen line at 1.2605. If the decline remains heavy and smashes beneath the 1.2588 barrier, the price could then readopt compelling negative tendencies.
Otherwise, if buying interest intensifies and the bulls gain some footing off the cloud and 100-period SMA, pushing past the red Tenkan-sen line at 1.2670, resistance could develop around the 200-period SMA at 1.2705 and the 1.2713 obstacle overhead. Surpassing these hurdles, buyers would need to overtake the capping area of highs from 1.2743-1.2782 to reinforce belief in the climb. Successfully doing so could boost confidence propelling the price to test the 1.2828 and 1.2844 highs respectively.
Summarizing USDCAD maintains a broader bearish bias and as things stand the scale is leaning towards a sound negative outcome.


 Signal2forex.com - Best Forex robots and signals


