As we noted in yesterday’s analysis of EUR/USD, the US dollar has been on tear over the last month, reversing its trend of relative weakness over the previous three quarters.
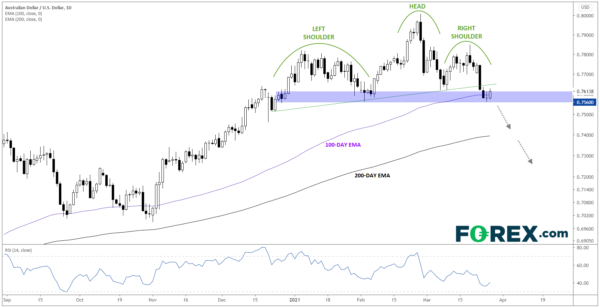
The recent moves have flipped the technical bias in favor of the greenback against most of her major rivals, but arguably the most compelling technical setup is in AUD/USD, which has carved out a huge head-and-shoulders pattern over the last three months. For the uninitiated, this classic pattern shows a shift from an uptrend (higher highs and higher lows) to a downtrend (lower lows and lower highs) and often marks a significant top in the chart.
The pattern is typically confirmed by a break below the “neckline”; in this case, the neckline can be represented either by the ascending trend line near 0.7650 (already broken) or the horizontal support level at 0.7560 (still intact). As the chart below shows, the 100-day EMA also comes in near 0.7600, providing another reason to monitor the 0.7560-0.7600 zone as a significant long-term area:
Source: StoneX, TradingView
For traders looking to short AUD/USD, one potential strategy would be to wait for rates to confirm the break below 0.7560 to enter a trade with a stop above 0.7600 or 0.7650 with targets at either the 200-day EMA near 0.7400 or even the head-and-shoulders pattern’s “measured move” objective in the lower 0.7000s. Meanwhile, if AUD/USD is able to hold support and rally above 0.7700, it would erase the near-term bearish bias
Key Australian and US data to watch in the coming week:
- Monday: n/a
- Tuesday: US Consumer Confidence
- Wednesday: US ADP Employment Report
- Thursday: AU Retail Sales, US ISM Manufacturing PMI
- Friday: US Non-Farm Payrolls


 Signal2forex.com - Best Forex robots and signals


