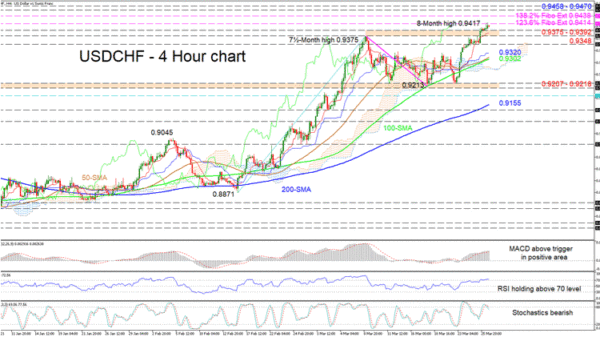
USDCHF is tackling the 0.9414 level, which happens to be the 123.6% Fibonacci extension of the down leg from 0.9375 to 0.9213. The soaring simple moving averages (SMAs) are nurturing the positive structure, while the Ichimoku lines are reflecting a minor pausing in bullish sentiment.
However, the short-term oscillators are transmitting mixed signals in directional momentum. The MACD, in the positive region, is holding above its slowing red trigger line, while the downwards pointing RSI, is persisting above the 70 level. That said, the recently adopted bearish tone in the stochastic oscillator is promoting growing negative momentum in the pair.
To the upside, instant resistance may develop from the 123.6% Fibo extension of 0.9414. If buying interest increases and the pair surges above this level and the fresh eight-month peak of 0.9417, the bulls may then target the 1382% Fibo extension of 0.9438. From here, slightly higher the resistance section of 0.9458-0.9470 could play a key role in the pair’s shift to a stronger bullish bias.
Alternatively, if sellers resurface, initial support may arise from the 0.9375-0.9392 section ahead of the vital trough at 0.9348. Should the price return below this, a zone of support could evolve from the blue Kijun-sen line at 0.9320 until the 100-period SMA at 0.9302.
Summarizing, USDCHF’s short-term bias remains increasingly bullish above the SMAs and the 0.9207-0.9218 support base. However, a dip below 0.9348 could signal a boost in selling interest.


 Signal2forex.com - Best Forex robots and signals


