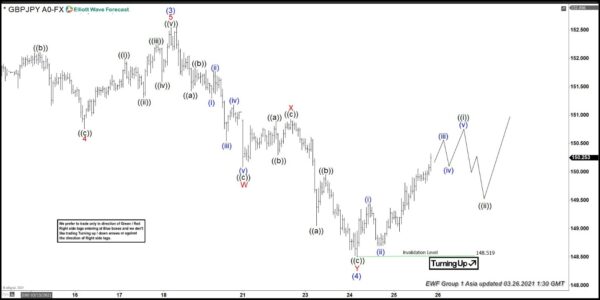
Rally from September 21, 2020 low in $GBPJPY is unfolding as a 5 waves impulse Elliott Wave structure. Up from September 21, 2020 low, wave (1) ended at 140.7 and pullback in wave (2) ended at 136.79. Pair resumed higher again and ended wave (3) at 152.55 as 1 hour chart below shows. Wave (4) pullback is proposed complete at 148.52 as a double three Elliott Wave structure.
Down from wave (3), wave ((a)) ended at 151.43, bounce in wave ((b)) ended at 151.83, and wave ((c)) lower ended at 150.09. This completed wave W in higher degree. Rally in wave X ended at 150.93. Pair then resumed lower in wave Y with internal subdivision as a zigzag. Down from wave X, wave ((a)) ended at 149.05, bounce in wave ((b)) ended at 149.96, and pair resumed lower and ended wave ((c)) at 148.52. This completed wave Y of (4).
Pair has turned higher in wave (5) but still needs to break above wave (3) at 152.55 to rule out a double correction. Near term, as far as dips stay above 148.52, expect pair to extend higher.
GBPJPY 60 Minutes Elliott Wave Chart


 Signal2forex.com - Best Forex robots and signals


