
📑 Table of Contents
- 1. What Is the ISM Services PMI?
- 2. How the ISM Services PMI Is Calculated
- 3. ISM Services PMI vs Manufacturing PMI — Key Differences
- 4. Why the ISM Services PMI Matters for Forex and Stocks
- 5. How to Trade the ISM Services PMI Release
- 6. ISM Services PMI Historical Data (2021–2026)
- 7. ISM Services PMI Reference Table
- 8. Frequently Asked Questions
1. What Is the ISM Services PMI?
The ISM Services PMI (formerly the Non-Manufacturing Index) is a monthly economic indicator that measures the health of the US services sector. Published by the Institute for Supply Management (ISM), it is based on a survey of supply executives in services industries. A reading above 50 indicates expansion, below 50 indicates contraction, and the report covers business activity, new orders, employment, and prices paid.
The services sector accounts for approximately 70% of US GDP, making the ISM Services PMI one of the most important economic indicators for traders and investors. It provides a timely snapshot of economic activity in industries ranging from finance and healthcare to hospitality and retail.
Simple Definition
The ISM Services PMI is a diffusion index that measures the health of the US services sector. It is based on a monthly survey of purchasing and supply executives across 18 services industries. The index is calculated by averaging the responses to questions about business activity, new orders, employment, and supplier deliveries.
Who Publishes the Report and When?
The Institute for Supply Management (ISM) publishes the Services PMI report on the 3rd business day of each month at 10:00 AM ET. This makes it one of the earliest monthly economic indicators released, providing traders with timely insight into the state of the economy. The report is released alongside the ISM Manufacturing PMI, which comes out on the 1st business day of the month, giving traders a comprehensive view of both sides of the US economy.
2. How the ISM Services PMI Is Calculated
The ISM Services PMI is a composite index derived from a survey of supply executives across 18 industries. Understanding its components is essential for interpreting the data correctly.
The 50 Threshold — Expansion vs Contraction
The 50 level is the dividing line between expansion and contraction. A reading above 50 indicates that the services sector is expanding. A reading below 50 indicates that it is contracting. The further the reading is from 50, the stronger the expansion or contraction.
Key Sub-Indices — New Orders, Employment, Prices Paid
The ISM Services PMI report includes several sub-indices that provide deeper insight into the economy:
- Business Activity: A leading indicator that tracks current activity levels in services industries.
- New Orders: A forward-looking indicator that measures future demand. This is often the most closely watched sub-index.
- Employment: Tracks hiring and job growth in the services sector, a key component of the labour market.
- Prices Paid: Measures inflation pressures in the services sector.
- Supplier Deliveries: Tracks supply chain conditions. A higher reading indicates slower deliveries (often due to demand or supply issues).
The Business Activity Index
The Business Activity Index is the services equivalent of the Production Index in the Manufacturing PMI. It tracks the month-over-month change in business activity levels and is often considered a leading indicator for GDP growth.
3. ISM Services PMI vs Manufacturing PMI — Key Differences
Both the ISM Services PMI and the ISM Manufacturing PMI are essential economic indicators, but they measure different parts of the economy. The table below summarises the key differences.
| Feature | ISM Services PMI | ISM Manufacturing PMI |
|---|---|---|
| Full Name | ISM Services PMI (Non-Manufacturing) | ISM Manufacturing PMI |
| Sector | Services (accommodation, finance, healthcare, etc.) | Manufacturing (durable & nondurable goods) |
| Survey Respondents | Supply executives in services industries | Supply executives in manufacturing industries |
| Key Sub-Indices | Business Activity, New Orders, Employment, Prices Paid | Production, New Orders, Employment, Inventories, Supplier Deliveries |
| Timing | Released on 3rd business day of the month | Released on 1st business day of the month |
| Market Impact | Major (services = 70%+ of US GDP) | Major (leading indicator) |
| Trading Focus | USD pairs, US stocks | USD pairs, industrial stocks |
| Typical Reaction | Beat = USD bullish, Miss = USD bearish | Beat = USD bullish, Miss = USD bearish |
📌 The Services PMI covers a larger portion of the US economy, making it a broader indicator of economic health. However, the Manufacturing PMI is often considered a better leading indicator due to its sensitivity to economic turning points.
4. Why the ISM Services PMI Matters for Forex and Stocks
The ISM Services PMI is one of the most influential economic releases for financial markets. Here is why it matters.
Impact on Currency Markets
A higher-than-expected ISM Services PMI typically strengthens the US Dollar (USD) as it signals a strong economy and raises the likelihood of tighter monetary policy from the Federal Reserve. Conversely, a lower-than-expected reading typically weakens the Dollar as it suggests economic weakness and potential for rate cuts. The most volatile currency pairs during the release are EUR/USD, GBP/USD, and USD/JPY.
Impact on Stock Markets
The ISM Services PMI also influences stock markets. A strong reading boosts investor confidence in the broader economy, supporting gains in US equities, particularly in services-heavy sectors like technology, healthcare, and financials. A weak reading can trigger selloffs as investors worry about slowing growth. The S&P 500 is particularly sensitive to this report.
The ISM and Federal Reserve Policy
The Federal Reserve closely monitors the ISM Services PMI as part of its policy decision-making. A consistently strong reading suggests the economy is robust and may warrant tighter monetary policy (higher rates). A weakening reading may prompt the Fed to consider easing. The Prices Paid sub-index is especially important for inflation expectations.
5. How to Trade the ISM Services PMI Release
Trading the ISM Services PMI requires a disciplined approach. Here is a step-by-step strategy for trading this high-impact data release.
Before the Release — Market Expectations
- Check the consensus forecast from sources like Bloomberg, Reuters, or the economic calendar.
- Review historical data to understand the current trend and whether the market is expecting an improvement or deterioration.
- Monitor the sub-indices — New Orders and Employment are often the most important for market reaction.
- Set price alerts on key currency pairs and indices to catch the initial move.
During the Release — Trading the Surprise
- A beat (higher than expected) is typically bullish for USD and US stocks. Consider buying USD pairs and US indices.
- A miss (lower than expected) is typically bearish for USD and US stocks. Consider selling USD pairs and US indices.
- An in-line reading often triggers a muted reaction, but the sub-indices can provide additional direction.
- Watch the New Orders sub-index — if New Orders beat expectations, the reading is likely more bullish than the headline suggests.
- Watch the Employment sub-index — if Employment misses, the reading is likely more bearish than the headline suggests.
After the Release — Trend Confirmation
- Wait for the initial volatility to settle before entering a position. The first 5-10 minutes can be erratic.
- Look for follow-through in the direction of the initial move. If the move sustains, it is more likely to continue.
- Consider the context — if the reading is in line with the recent trend, the move may be limited.
- Place stop-losses beyond the pre-release range to protect against reversals.
Trading Tip: The ISM Services PMI is often a market-moving event. Trade with appropriate position sizing and always use stop-loss orders.
6. ISM Services PMI Historical Data (2021–2026)
The table below shows the historical ISM Services PMI data from March 2021 through March 2026, including key sub-indices.
| Date | ISM Services PMI | Business Activity | New Orders | Employment | Prices Paid |
|---|---|---|---|---|---|
| Mar 2026 | 55.2 | 58.0 | 54.5 | 51.8 | 62.4 |
| Dec 2025 | 54.1 | 56.5 | 53.8 | 50.2 | 60.1 |
| Sep 2025 | 53.4 | 55.2 | 52.6 | 49.5 | 58.7 |
| Jun 2025 | 52.8 | 54.0 | 51.9 | 48.9 | 57.2 |
| Mar 2025 | 51.9 | 52.8 | 50.7 | 48.0 | 55.8 |
| Dec 2024 | 50.6 | 51.5 | 49.8 | 47.5 | 54.1 |
| Sep 2024 | 49.8 | 50.2 | 48.5 | 46.8 | 52.9 |
| Jun 2024 | 48.6 | 49.0 | 47.2 | 45.5 | 51.8 |
| Mar 2024 | 49.2 | 49.8 | 47.9 | 46.0 | 52.1 |
| Dec 2023 | 50.8 | 51.8 | 49.5 | 47.2 | 53.5 |
| Sep 2023 | 52.1 | 53.5 | 51.2 | 48.8 | 55.2 |
| Jun 2023 | 53.4 | 55.0 | 52.8 | 50.2 | 56.8 |
| Mar 2023 | 54.8 | 56.5 | 54.2 | 51.5 | 58.5 |
| Dec 2022 | 55.6 | 57.8 | 55.1 | 52.5 | 60.2 |
| Sep 2022 | 56.2 | 58.5 | 55.8 | 53.0 | 61.5 |
| Jun 2022 | 57.1 | 59.2 | 56.5 | 53.8 | 62.8 |
| Mar 2022 | 58.2 | 60.5 | 57.8 | 54.5 | 64.2 |
| Dec 2021 | 59.8 | 62.0 | 59.2 | 55.8 | 66.5 |
| Sep 2021 | 61.2 | 63.5 | 60.8 | 57.2 | 68.0 |
| Jun 2021 | 62.5 | 64.8 | 61.5 | 58.0 | 69.5 |
| Mar 2021 | 63.7 | 69.4 | 67.2 | 59.5 | 74.2 |
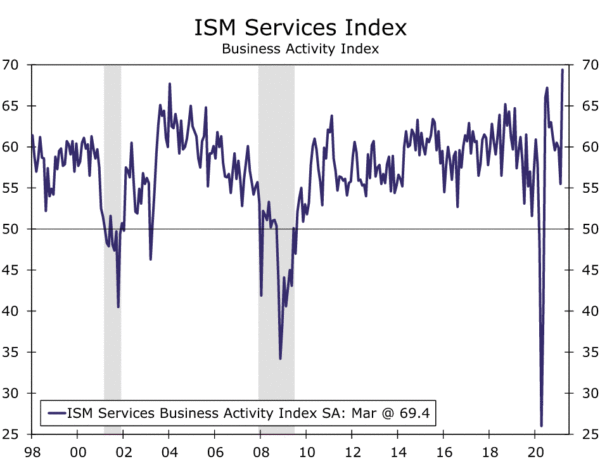
📌 Data reflects the ISM Services PMI (formerly Non-Manufacturing Index). March 2021 marked a record high of 63.7 during the post-COVID recovery.
7. ISM Services PMI Reference Table
This reference table provides a quick summary of the key concepts related to the ISM Services PMI.
| Concept | Description |
|---|---|
| ISM Services PMI | Monthly economic indicator measuring the health of the US services sector (70%+ of GDP) |
| Release Date | 3rd business day of each month at 10:00 AM ET |
| 50 Threshold | Above 50 = expansion; below 50 = contraction |
| Key Sub-Indices | Business Activity, New Orders, Employment, Prices Paid, Supplier Deliveries |
| Market Impact | Major — USD pairs, US stocks, bonds |
| Fed Watch | Closely monitored for monetary policy signals |
| Record High | 63.7 (March 2021) |
| Publisher | Institute for Supply Management (ISM) |
📌 The ISM Services PMI is one of the most closely watched economic indicators for traders and investors.
8. Frequently Asked Questions
What is the ISM Services PMI?
The ISM Services PMI (formerly the Non-Manufacturing Index) is a monthly economic indicator published by the Institute for Supply Management (ISM) that measures the health of the US services sector, which accounts for over 70% of US GDP.
When is the ISM Services PMI released?
The ISM Services PMI is released on the 3rd business day of each month at 10:00 AM ET. It is one of the most closely watched economic indicators for the services sector.
What does the ISM Services PMI measure?
The ISM Services PMI measures business activity, new orders, employment, supplier deliveries, and prices paid in the services sector. A reading above 50 indicates expansion, while below 50 indicates contraction.
How does the ISM Services PMI impact forex markets?
A higher-than-expected ISM Services PMI typically strengthens the US Dollar as it signals a strong economy and potential for higher interest rates. A lower-than-expected reading typically weakens the Dollar.
What is the difference between ISM Services PMI and Manufacturing PMI?
The ISM Services PMI measures the services sector (finance, healthcare, hospitality, etc.), while the Manufacturing PMI measures the goods-producing sector. Services PMI covers about 70%+ of US GDP, making it a broader indicator.
What is the 50 threshold in the ISM Services PMI?
The 50 level is the dividing line between expansion and contraction. A reading above 50 indicates the services sector is expanding. A reading below 50 indicates it is contracting.
Which sub-indices are most important in the ISM Services PMI?
The most important sub-indices are Business Activity (leading indicator), New Orders (future activity), Employment (jobs growth), and Prices Paid (inflation). New Orders is often considered the most forward-looking.
How can I trade the ISM Services PMI release?
Traders typically look for the deviation from market expectations. A beat (higher than expected) is bullish for USD; a miss (lower than expected) is bearish. The New Orders and Employment sub-indices also provide additional trading signals.
What is the relationship between ISM Services PMI and GDP?
The ISM Services PMI has a strong positive correlation with US GDP growth. A rising Services PMI typically signals accelerating economic growth, while a falling PMI signals slowing growth.
How has the ISM Services PMI performed historically?
The ISM Services PMI hit a record high of 63.7 in March 2021 during the post-COVID recovery. Since then, it has gradually declined toward the 50-55 range as the economy has normalised, with occasional fluctuations due to interest rates and inflation.
🏭 Compare Services and Manufacturing PMI: While the ISM Services PMI measures the dominant services sector, the ISM Manufacturing Index provides a complementary view of the goods-producing economy. Our analysis of the 20th consecutive month of manufacturing expansion shows how supply chains, new orders, and employment trends in manufacturing can confirm or contradict signals from the Services PMI.
📈 Track the Full Picture of US Economic Strength: The ISM Manufacturing Index continued its expansion streak into a 22nd consecutive month, demonstrating the resilience of the US economy amid supply chain challenges and inflation. This report complements the Services PMI by showing how both sides of the economy — goods and services — have performed through the post-pandemic recovery period.



 Signal2forex.com - Best Forex robots and signals


