The BOC will take note of the strong employment print, as they are currently the frontrunner to taper monetary policy!
The Canadian Employment Change for March was +301,100 vs and expectation of +100,000 and +259,200 in February. The number was strong across the board, with the breakdown split between +175,000 fulltime jobs and +128,000 part time jobs. The level of employment is within 1.5% of February 2020 levels (pre-covid)! In addition, the Unemployment Rate fell from 8% to 7.5%, vs 8% expected. Canada has signaled they may be one of the first to begin tapering their stimulus program, and this number will make the BOC’s decision a little easier. However, Ontario just entered a lockdown and coronavirus cases are rising across the country. The BOC meets on April 21st. They may be more interested in April’s jobs data than March’s.
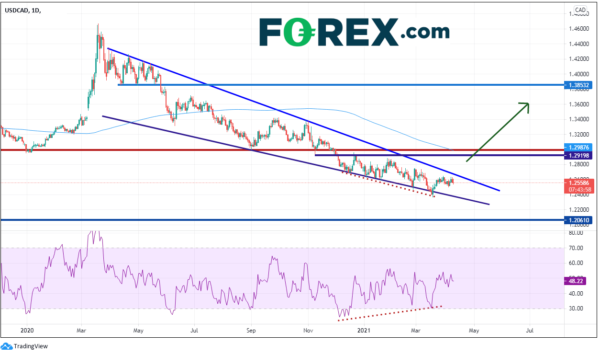
On a daily timeframe, the short-term move lower in USD/CAD on the data release (roughly 30 pips) hasn’t broken any significant levels. The pair has been in a descending wedge since the beginning of the pandemic on March 2020. The RSI became oversold and diverged with price throughout the first quarter of this year, however it has since bounced, and price remains in the wedge. The expectation from a descending wedge is that price will break to the upside. With the RSI back in neutral territory and USD/CAD mid-range with the wedge as it approaches the apex, we may have to wait for the BOC meeting to see a significant move. The top trendline of the wedge crosses at near 1.2675 and the bottom trendline crosses near the March 18th lows near 1.2400.
Source: Tradingview, FOREX.com
However, on a short-term 240-minute timeframe, the move lower in USD/CAD is threatening to break below the upward sloping trendline of a symmetrical triangle near 1.2540. If price breaks below, the next support is the April 5th lows near 1.2500, ahead of the previously mentioned long-term downward sloping trendline of the wedge on the daily near 1.2400. 1.2365 is the March 18th lows and final support before price can drop to 1.2060 (see daily). Initial resistance is at 1.2647, which is the March 30th highs. Above there is the short-term downward sloping trendline from the symmetrical triangle on the 240-minute timeframe near 1.2680, which confluences with the longer-term trendline from the descending wedge.
Source: Tradingview, FOREX.com
After an earlier delay, the BLS reported US PPI which was stronger than expected. However, the stronger Canadian employment change is outweighing the strong PPI data. Therefore, USD/CAD is offered. As the Fed has said they are not concerned about inflation, the US PPI shouldn’t matter much. However, the BOC will take note of the strong employment print, as they are currently the frontrunner to taper monetary policy!
 Signal2forex.com - Best Forex robots and signals


