The US 500 stock index (Cash) is sustaining its bullish tone above the rising Ichimoku lines, which are nourishing the price’s attempts to steer higher. Additionally, the advancing simple moving averages (SMAs) are shielding the positive structure.
The short-term oscillators are reflecting the resilience of the index to survive attempts to retrace to a certain degree. The MACD is keeping above its red trigger line in the positive region, while the RSI is sustaining its recent nudge into the overbought territory. Likewise, the stochastic oscillator is stubbornly persistent above the 80 level, promoting an extension of the current trajectory as its %K line has now prodded back over its %D line.
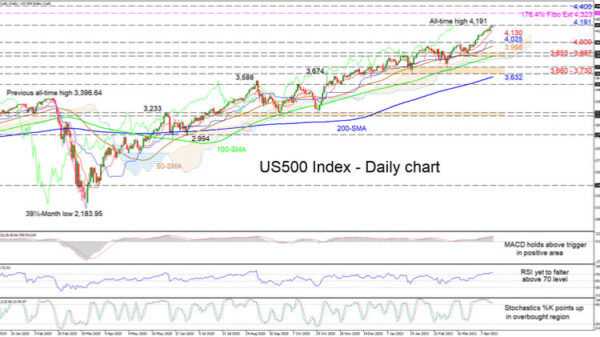
To the upside, on overstepping the 4,191 mark, buyers immediately will be entering unfamiliar territory, plotting fresh all-time highs as they propel towards an initial possible resistance at the 4,323 level, which happens to be the 176.4% Fibonacci extension of the down leg from 3,397 until 2,184. Surpassing this too, the price may then test the 4,400 barrier.
Should sellers manage to make a stand, first support could develop around the Ichimoku lines at 4,130 and 4,025 respectively, before the price challenges the vital border at the 4,000 mark. Plunging underneath this, the index may then meet the 50-day SMA at 3,966 before aiming for the support section of 3,853-3,887, which overlaps with the Ichimoku cloud.
Overall, the index is maintaining its bullish bias above the 4,000 boundary and the SMAs. However, if the price were to glide below the 3,660-3,730 base, the positive patterns’ potency could come into question.
 Signal2forex.com - Best Forex robots and signals


