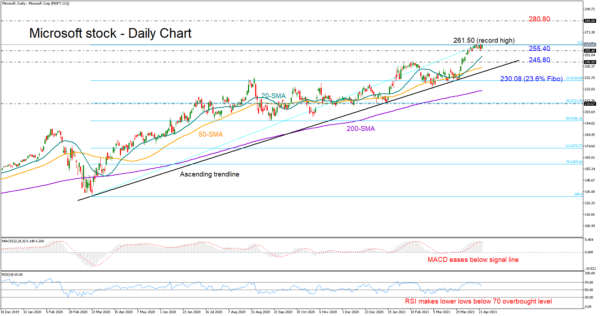
Microsoft Inc stock had its best month in almost a year, surging by 10.5% to top at a new all-time high of 261.50 on Thursday.
The bullish fuel, however, seems to be running low according to the technical picture, suggesting that the recent tight range-bound trading could result in a downside correction. Specifically, the RSI seems to be making lower lows below its 70 overbought level, while the MACD is set to slip back below its red signal line.
Traders may remain patient until the price dips below 255.40 and more importantly closes below the 20-day simple moving average (SMA) before targeting the former resistance around 245.80. Beneath the latter, the ascending trendline may prevent any move towards the 23.6% Fibonacci of the 132.43 – 261.50 up leg at 230.00.
On the upside, a bounce above 261.50 may continue towards 280.80 level – being the 261.8% Fibonacci extension of the 245.80 – 224.15 down leg.
In brief, Microsoft could give up some ground after an impressive rally. Initial support could come near 255.40, while a resumption of the long-term uptrend could peak near 280.80.
Note that the giant tech company is scheduled to release its quartnerly earnings on Tuesday after the market close.
 Signal2forex.com - Best Forex robots and signals


