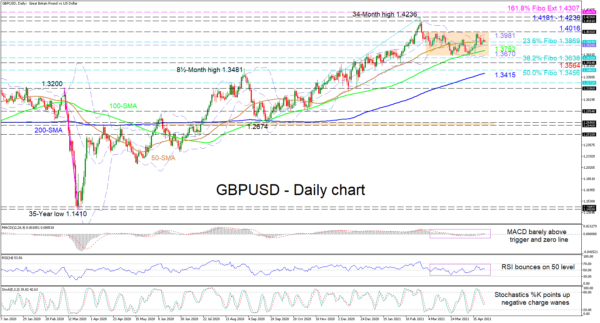
GBPUSD is flirting with the 1.3869 level, which happens to be the 23.6% Fibonacci retracement of the up leg from 1.2674 until the 34-month high of 1.4236, after the price pullback found some footing off the 100-day simple moving average (SMA). The bullish SMAs are shielding the positive structure, while the slowed incline of the 50-day SMA is endorsing a more neutral-to-bullish tone.
The conflicting signals in sentiment in the short-term oscillators are indicating a phase of weak directional momentum. The MACD is holding marginally above its red trigger and zero lines, while the RSI is striving to remain in the bullish region. The stochastic %K line has turned upwards and is suggesting some fading in negative price impetus.
If sellers manage to penetrate below the immediate support zone from the 50-day SMA at 1.3869 until the mid-Bollinger band at 1.3820, the 100-day SMA at 1.3752 could attempt to prevent sellers from regaining an edge. However, should they steer even lower, the support base from the lower Bollinger band at 1.3670 until the 38.2% Fibo of 1.3638 may succeed in extending the lifespan of the minor horizontal price structure. Failing to negate a deeper retracement though could then bolster selling interest, sending the price to test the 1.3564 trough and the 50.0% Fibo of 1.3456.
Otherwise, if buyers take the lead off the 50-day SMA at 1.3869, initial resistance may arise at the upper Bollinger band at 1.3981 ahead of the ceiling of the range at 1.4016. Surpassing this heavy barrier, the pair may catapult towards the next resistance section residing between the 1.4181 level and the multi-year peak of 1.4236. Maintaining the upper hand, buyers may then target the 1.4307 level, that being the 161.8% Fibonacci extension of the down leg from 1.3200 until 1.1410.
Summarizing, for a more decisive direction to evolve, GBPUSD would need to either defeat the 1.4016 roof or break below the 38.2% Fibo of 1.3638.
 Signal2forex.com - Best Forex robots and signals


