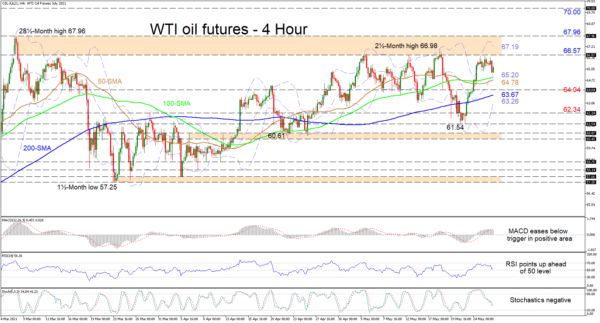
WTI oil futures have retreated before really challenging the vital resistance section of 66.57-67.96 and are now finding some footing near the mid-Bollinger band at 65.20 on the four-hour chart. The improving 50-period simple moving average (SMA) and the 100- and 200-period SMAs are endorsing a more neutral-to-bullish bearing.
The short-term oscillators are mirroring the pullback in price but are currently transmitting mixed signals in directional momentum. The MACD, above the zero threshold, has slipped beneath its red trigger line but is looking set to return above it, while the RSI is trying to pivot higher prior to reaching the 50 level. On the other hand, the negatively charged stochastic oscillator is promoting a deeper drop in the price of the commodity.
To the downside, sellers face a direct cluster of support barriers in the area from the mid-Bollinger band at 65.20 until the 50-period SMA at 64.78. Successfully steering the price beneath this zone, the 64.04 border and the lingering 200-period SMA underneath at 63.67, may manage to provide some sturdy downside defences. However, failing to deter a deeper decline from evolving, the price may then meet the lower Bollinger band at 63.26, before sellers dive for the 62.34 obstacle.
If a strong foothold develops off the mid-Bollinger band at 65.20, just above the 100- and 50-period SMAs, the bull’s primary upside limitations may emanate from the durable resistance section of 66.57-67.96. In order to conquer this crucial boundary, reinforced with rally peaks from April 2019 and October 2018, more intense buying interest would be required to help navigate the price past the 68.00 mark. If efforts prove successful the door would open for the 70.00 handle.
Summarizing, WTI futures are slightly skewed to the upside despite recently ranging between the limits of 57.25 and 67.96 in the short-term timeframe. A push above 68.00 could boost the bullish bias, while a shift below 61.54 could cause the commodity’s price to become heavy.


 Signal2forex.com - Best Forex robots and signals


