WTI crude oil look to OPEC decision
Economies reopening has boosted fuel demand amid limited supply sending oil prices soaring. Oil has rallied over 10% across June alone.
The price of oil is nudging higher ahead of the OPEC meeting, supported by a bigger than expected draw in inventories.
Expectations are for between a 500,000 – 1 million barrels per day increase in supply. Given that demand is expected to increase by 5 million barrels a day across the second half of 2021, OPEC supply increases of these levels could be comfortably absorbed.
Read my colleague Matthew Weller’s OPEC preview
Where next for WTI crude oil?
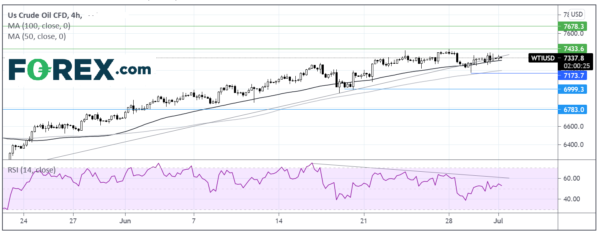
Gains in crude oil have slowed this week ahead of the OPEC meeting. The price is sitting on the ascending trendline which dates back to the start of June. It is being immediately supported by the 50 sma on the 40 hour chart at 73.00. The RSI is pretty neutral at 53. However the RSI is showing bearish divergence suggesting the run higher could be running out of steam.
A break below the 50 sma at 73.00 could see the 100 sma and June 29 low of 71.40 come into focus. A break below here could see the sellers gain traction and look to test 70.00 the key psychological level.
Should the 50 sma and ascending trendline hold the price could look back towards 74.30, June 28 high, bringing October 2018’s high of 76.80 back in play.
EUR/USD under pressure after weak German retail sales, US PMI data in focus
EUR/USD is under pressure for a fourth straight session, around a three month low, as rising US treasury yields, covid jitters underpin the US Dollar.
US ADP payrolls beat forecasts on Wednesday.
German retail sales miss forecasts rising 4.2% MoM in May, up from -5.5% in April, but short of the 5.5% forecast. Annually, sales came in at -2.4%, well down on the 10.1% increase forecast.
Looking ahead, ECB’s Lagarde US manufacturing PMI data eyed, in addition to jobless claims ahead of tomorrow’s non farm payrolls.
Where next for EUR/USD?
EUR/USD trades below its descending trendline dating back to early June, and below its 20 & 50 day ma in a bearish chart. The RSI is supportive of further losses whilst it remains out of oversold territory.
Immediate support at 1.840 the low from early March and late June is being tested. A break below this level is needed in order for the sellers to target 1.1760 the low 26 March ahead of 1.17 the April low.
Should 1.1840 hold, a recovery would need to retake the descending trend line at 1.19. A move above 1.1975 could see the buyers gain traction.


 Signal2forex.com - Best Forex robots and signals


