Technical analysis
The four-hour time frame shows that a bullish inverted head and shoulders pattern has formed after the BTCUSD pair rallied back above the $32,000 resistance level.
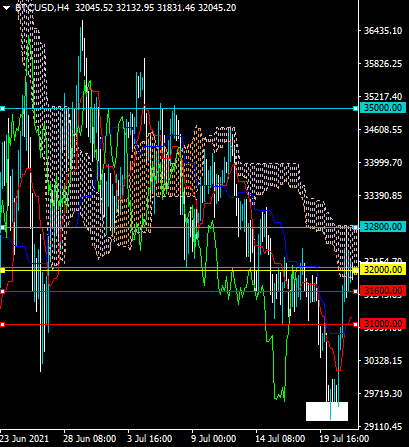
The Ichimoku indicator shows that the BTCUSD pair will break above the Ichimoku cloud if they are able to overcome the $32,800 resistance level.
What the possible outcomes are
In our most likely scenario, the BTCUSD pair breaks above the $32,800 resistance level and then starts to advance towards the next strongest area of resistance, around the $35,000 level.
Alternatively, the BTCUSD pair may correct back towards the $31,000 level to attract fresh buying interest before attempting to break above the $32,800 resistance level.
Key levels
Support $31,600 $31,000
Resistance $32,800 $35,000
 Signal2forex.com - Best Forex robots and signals


