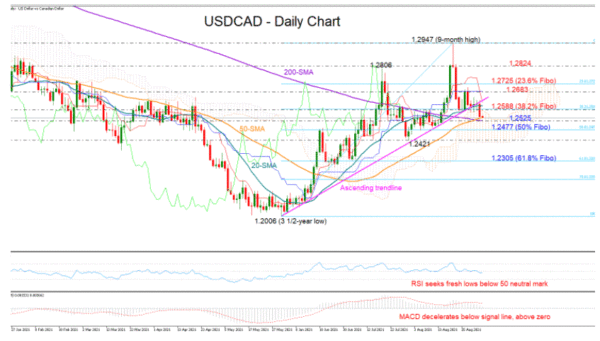
USDCAD bears snapped the ascending trendline after a three-day battle on Thursday, forcefully pushing the price towards the 50- and 200-day simple moving averages (SMAs) and to a two-week low of 1.2539 ahead of the all-important US nonfarm payrolls .
With the RSI dipping below its 50 neutral mark to seek fresh lows, and the MACD decelerating below its red signal line, expectations are for the negative momentum to dominate in the short term.
That said, the upward trajectory from the June low of 1.2006 is still valid despite the depreciation in the past two weeks and only an aggressive selling below the previous low of 1.2421 would disprove it, consequently shifting the spotlight towards the 1.2300 level – being the 61.8% Fibonacci retracement of the latest upleg. For now, the bullish SMA crosses continue to feed hopes for a continuation of the original positive trend.
In the meantime, the bears will also need to knock down the wall of 1.2525 – 1.2477 formed by the 200-day SMA and the 50% Fibonacci to keep the upper hand in the market.
In the event of an upside reversal, the pair could face some challenges between the 38.2% Fibonacci of 1.2588 and the broken supportive trendline, which could switch to resistance around 1.2630. Breaching these barriers, the focus will shift back to the 1.2683 handle and the 23.6% Fibonacci of 1.2725, while higher, a decisive close above 1.2824 would open the door for the 1.2947 peak.
Summarizing, USDCAD is currently exposed to additional negative corrections, though whether the sell-off can forestall the upward trajectory from June lows remains to be seen.


 Signal2forex.com - Best Forex robots and signals


