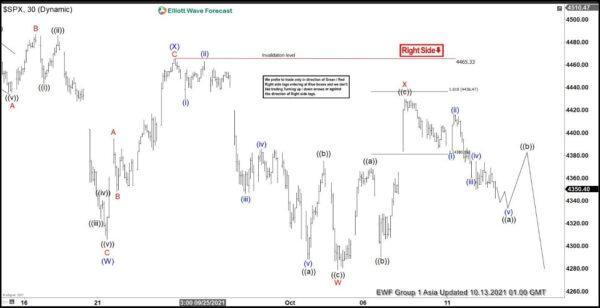
Short Term view in S&P 500 (SPX) suggests the decline from Sept 23, 2021 peak is unfolding as a double three Elliott Wave structure. Down from Sept 23 peak, wave W ended at 4278.94 as a zigzag structure. Wave ((a)) of W ended at 4288.52 and rally in wave ((b)) of W ended at 4375.19. The third leg wave ((c)) of W lower ended at 4278.94. Rally in wave X has ended at 4429.97 also as a zigzag structure. Up from wave W, wave ((a)) ended at 4369.23 and pullback in wave ((b)) ended at 4290.49. Final leg wave ((c)) of X ended at 4429.97.
Index has turned lower within wave Y with internal subdivision as a zigzag structure. Down from wave X, wave (i) ended at 4384.22 and bounce in wave (ii) ended at 4415.88. Wave (iii) lower ended at 4360.59. Rally in wave (iv) ended at 4743.89 and then turn lower to look for finish wave (v) as well as wave ((a)). Afterwards, it should rally in wave ((b)) to correct cycle from October 07 peak before the decline resumes again. Near term, as far as pivot at 4465.33 high remains intact, expect rally to fail in 3, 7, or 11 swing for more downside.
SPX 30 Minutes Elliott Wave Chart
 Signal2forex.com - Best Forex robots and signals


