The US added 531,000 non-farm jobs to the economy in October, stronger than the +455,000 that was forecasted. The September print was revised higher from +194,000 to +312,000, which makes the headline print more like +649,000! In addition, the Unemployment Rate fell to 4.6% vs 4.7% last. Average Hourly earnings was +0.4% vs +0.6% last. This is the 7th month in a row of positive earnings. This is the type of employment data the Fed was looking for when they met 2 days ago and decided that it was time to begin tapering bond purchase program at a rate of $15 billion per month.
However, there is one piece of data from the jobs report that may have the Fed concerned, and it is the Participation Rate. The rate remained at 61.6% in October vs an expectation of 61.8%. With the labor shortage contributing to bottlenecks and inflation, the Fed would like to see this number increase. In a speech just after the meeting, the Fed’s George said, “it will be a question of whether workers on the sidelines will come in over time to determine if we have reached maximum employment; THIS HAS TO HAPPEN.” Therefore, in addition the making sure earnings is increasing with inflation, it is also important to make sure that people are re-entering the labor force. Watch the Participate Rate moving forward.
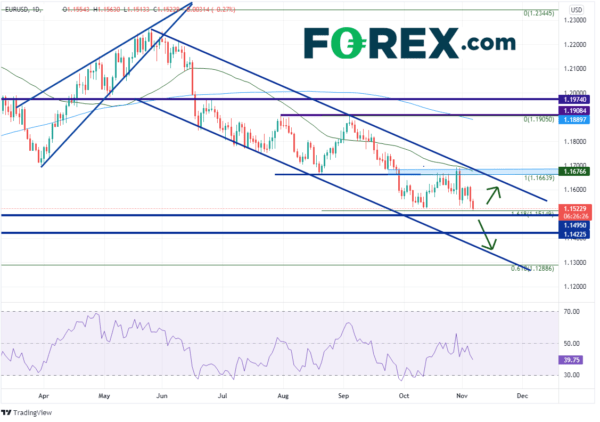
After the release of the data, EUR/USD moved to 15-month lows below 1.1525. On a daily timeframe, the pair has been drifting lower in a downward sloping channel since breaking out of an ascending wedge formation at the end of May, near 1.2263. The pair is currently trading near the 161.8% Fibonacci extension from the lows of August 19th to the highs of September 3rd, near 1.1515. Horizontal support dating back to the highs of 2020 are just below at 1.1495.
Source: Tradingview, Stone X
On a 240 minute timeframe, support below the 1.1495 level is at the 127.2% Fibonacci extension from the lows of October 12th to the highs of October 28th ,near 1.1479, and then a convergence of support at the 161.8% Fibonacci extension from the same timeframe and horizontal support from June 2020, near 1.1421. Short-term resistance is at 1.1616, ahead of a confluence or resistance (see daily) of the top downward sloping trendline from channel, the 50-Day Moving Average, and recent highs between 1.1675 and 1.1700,
Source: Tradingview, Stone X
The Non-Farm payroll data was clearly a stronger than expected print for October. However, the Fed will be watching both Average Hourly Earnings and the Labor Participation rate as well when future decisions. Traders should be watching as well!


 Signal2forex.com - Best Forex robots and signals


