Last week, the headlines were dominated by inflation, as US CPI came in much hotter than expected. Could this the final nail in the coffin which put a top in stock indices? That theme is likely to continue this week as traders receive a host of inflation data from around the world. If high inflation can’t put a top in stocks, what could be the next catalyst or black swan event that could cause a sell off? Oil is also still in the headlines as WTI pulls back to near $80. Is this just a correction, or will prices fall further this week? In addition to inflation data this week, the US, UK, and Canada will report Retail Sales and top retail stores will report earnings. Did people cut back spending because of rising prices?
Inflation
With large central banks on hiatus last week, markets turned to “data watching”, looking for signs that the central banks are wrong, and that they will be forced to raise rates earlier than they have projected. The markets may have found what they were looking for, in the form of inflation. First, US PPI was released on Tuesday, matching September’s print at 8.6%, which is the highest reading since November 2010. Then, US CPI was released on Wednesday, which showed a 6.2% rise in the headline number, the largest since November 1990! Finally, on Friday, the preliminary reading of the November Michigan Consumer Sentiment Index was released, which fell to 66.8 from 71.7, its lowest level since November 2011. The low reading was primarily based on higher inflation expectations. The 1-year inflation expectation rose to 4.9% while the 5-year inflation expectation was unchanged at 2.9%. A quick reminder that the Fed targets 2% inflation. Based on the current pace of bond tapering for the Fed, the program will finish in June 2022. Markets were quick to move forward their expectations for a Fed rate hike to June. Fed Chairman Powell has said the central bank will act if warranted. However, as of the latest FOMC meeting, inflation was still transitory.
S&P 500
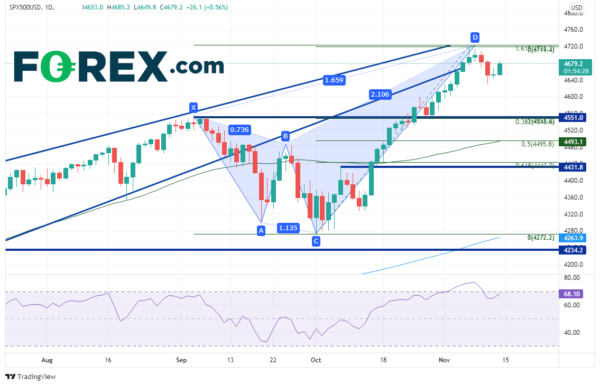
US Stock indices had pulled back going into the inflation data releases, as the S&P 500 Index headed to the 161.8% Fibonacci extension of the highs from September 3rd to the lows of October 1st.
Source: Tradingview, Stone X
This is a harmonic formation know as a shark pattern, and targets Fibonacci retracements on the pullback, near 4551, 4495.6 and 4443. However, stock indices have moved higher into the end of the week, with most major US indices closing down, on average, nearly 1%.
European Indices
Many of the European indices were near their all-time highs last week, including the FTSE 100, the DAX 40 and the CAC 40. However, is it time for European indices to pull back? And if so, what could cause it to happen? This week, a number of countries report inflation data, not just in Europe, but around the world. The UK dumps a load of inflation on Wednesday, as the EU releases CPI. Germany releases PPI on Friday as well. In addition, inflation information will be released from Canada, the US, and New Zealand this week. If the inflation data is as strong as that of the US, indices will likely pull back while currencies could get a boost vs the US Dollar (the US Dollar moved to 16-month highs last week).
Oil
Oil is still in the headlines as WTI pulled back to near $80. OPEC revised down their oil demand forecast for 2022. On Friday, US President Joe Biden pleaded with OPEC to release more oil. Whether it’s OPEC supplying more oil to the US or Joe Biden releasing reserves from the SPR, oil traders believe their will be more supply in the markets. Watch for more comments this week!
Watch headlines
Other headlines which may affect markets this week are as follows:
- The spike in coronavirus cases in Europe (Germany is at all-time highs in number of new cases)
- The immigration problem in Belarus.
- Russia building up troops on Ukraine border?
- China data dump on Monday
- Fed Chairman pick: Powell or Brainard?
Retail Week
It’s also “Retail Week”! Retail Sales will be released this week from the US, UK and Canada. My colleague Matt Weller writes the following regarding the upcoming retail sales data:
“Tackling US retail sales first, consumers are expected to have increased their spending by 1.2% m/m, with the core (ex-auto) figure rising 1.0% m/m. With global supply chains still gummed up, there’s a chance that many consumers pulled forward their Christmas shopping from the usual November window to October to avoid any risk of shipping delays ruining their holidays (…or was that just my wife?), so an upside surprise is possible from the US report, and similar dynamics are at play in the UK and Canada as well.
Looking at specific retailers’ results, “The Big 4” to watch next week will be as follows (all releases are before the opening bell):
- Walmart (WMT): Tuesday – $1.39 in EPS expected on $135.7B in revenue
- Home Depot (HD): Tuesday – $3.38 in EPS expected on $34.5B in revenue
- Target (TGT): Wednesday – $2.81 in EPS expected on $24.6B in revenue
- Lowes (LOW): Wednesday – $2.40 in EPS expected on $21.6B in revenue”
Earnings
Earnings season is winding down. However, there are a few earnings releases next week to watch in addition to the Big 4 mentioned above. They are as follows: HD, WMT, NTES, BIDU, CSCO, TGT, LOW, MANU, BABA, AMAT, INTU, JD
Economic Data
We already mentioned the Inflation data and Retail Sales data to be released this week. In addition, Japan releases its first look at Q3 GDP, the UK its report Claimant Count for October and Australia releases the RBA minutes from its latest meeting. Other important economic data is as follows:
Monday
- New Zealand: Services NZ PSI (OCT)
- Japan: GDP Growth Rate Prel (Q3)
- China: Industrial Production (OCT)
- China: Retail Sales (OCT)
- China: Unemployment Rate (OCT)
- Japan: Industrial Production Final (SEP)
- Germany: Wholesale Prices (OCT)
- EU: Trade Balance (SEP)
- US: NY Empire State Manufacturing Index (NOV)
Tuesday
- Australia: RBA Meeting Minutes
- Australia: RBA Governor Lowe Speech
- UK: Claimant Count Change (OCT)
- EU: Employment Change Prel (Q3)
- EU: GDP Growth Rate 2nd Estimate (Q3)
- Canada: PPI (OCT)
- Canada: Housing Starts (OCT)
- US: Retail Sales (OCT)
- US: Import Prices (OCT)
- US: Export Prices (OCT)
- US: Industrial Production (OCT)
- US: Manufacturing Production (OCT)
- US: Capacity Utilization (OCT)
- US: NAHB Housing Market Index (NOV)
Wednesday
- Japan: Trade Balance (OCT)
- Japan: Machinery Orders (SEP)
- Australia: Wage Price Index (Q3)
- UK: Inflation Data (OCT)
- EU: CPI (OCT)
- EU: Construction Output (SEP)
- Canada: CPI (OCT)
- US: Housing Starts (OCT)
- US: Building Permits (OCT)
- Crude Inventories
Thursday
- New Zealand: PPI (Q3)
- New Zealand: Business Inflation Expectations (Q4)
- US: Philadelphia Fed Manufacturing Index (NOV)
Friday
- Japan: CPI (OCT)
- Germany: PPI (OCT)
- UK: Retail Sales (OCT)
- Canada: New Housing Price Index (OCT)
- Canada: Retail Sales (SEP)
Chart of the Week: Weekly US Dollar Index (DXY)
Source: Tradingview, Stone X
The US Dollar Index (DXY) has broken above key resistance to its highest level since July 2020! The DXY had been rising since the week of May 24th, when it made a low of 89.535. This week. the DXY traded above the 38.2% Fibonacci retracement from the March 2020 highs to the January 2021 lows, at 94.47. In addition, it broke above a long-term rising trendline (red) that dates to April 2011. There is room to run for the DXY, however it must clear horizontal resistance at 95.71 and the 50% retracement from the recently mentioned timeframe at 96.10. Above there is the 61.8% Fibonacci retracement at 97.73. If the break higher proves to be a false breakout, the week’s low provides first support at 93.87 and then a rising trendline from the May lows at 93.28. Below there is horizontal support at 91.78. (Remember that the DXY has a high correlation to EUR/USD, which is why the pair is trading at its lowest level in 16 months!)
According to Christine Lagarde, “Inflation, Inflation and Inflation” is all they talked about at the ECB meeting a few weeks ago. Last week, inflation seems to be the only thing that the markets are talking about as well. The theme should continue this week as more inflation data is set to be released from other parts of the globe, in addition to the US. Watch for signs of continued rising inflation, as well as, the retail sales data. Did people put off purchases because prices were too high? We’ll find out this week!
Have a great weekend!
 Signal2forex.com - Best Forex robots and signals


