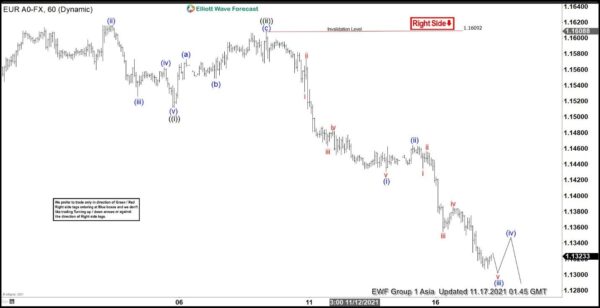
Short Term Elliott Wave view on EURUSD suggests the decline from October 28 peak is unfolding as a 5 waves impulse Elliott Wave structure. Down from October 28, wave (i) ended at 1.1533 and rally in wave (ii) ended at 1.16164. Pair then extends lower in wave (iii) towards 1.1526 and bounce in wave (iv) ended at 1.1563. Pair extends in another leg lower in wave (v) towards 1.1512 to complete wave ((i)) in higher degree.
Wave ((ii)) rally ended at 1.1608 with internal subdivision as a zigzag. Up from wave ((i)), wave (a) ended at 1.1573, wave (b) ended at 1.1549, and wave (c) ended at 1.1608. Pair then resumes lower in wave ((iii)) which is currently still in progress as an impulse in lesser degree. Down from wave ((ii)), wave (i) ended at 1.143 and rally in wave (ii) ended at 1.1464. Expect wave (iii) to end soon, then pair should bounce in wave (iv) before turning lower again in wave (v) to end wave ((iii)). Near term, as far as pivot at 1.1608 stays intact, expect rally to fail in 3, 7, or 11 swing for further downside.
EURUSD 60 Minutes Elliott Wave Chart
 Signal2forex.com - Best Forex robots and signals


