
📑 Table of Contents
- 1. What Is the GER40 / DAX 40 Index?
- 2. GER40 Technical Analysis — August 2026
- 3. Key Support and Resistance Levels for GER40
- 4. GER40 Trading Strategies for 2026
- 5. Complete Comparison Table: GER40 vs Other Major Indices
- 6. What Moves the GER40? — Key Fundamental Drivers
- 7. Frequently Asked Questions
1. What Is the GER40 / DAX 40 Index?
The GER40, also known as the DAX 40 or DE40, is Germany’s premier stock market index. It tracks the performance of the 40 largest and most liquid companies listed on the Frankfurt Stock Exchange. The index is weighted by market capitalisation and includes industry giants such as SAP, Siemens, Deutsche Telekom, Allianz, and Mercedes-Benz Group.
The DAX 40 replaced the DAX 30 in September 2021, expanding from 30 to 40 constituents to provide a more comprehensive representation of the German economy. This change increased the index’s coverage to approximately 80% of the total market capitalisation of all listed German companies.
For traders, the GER40 is one of the most traded indices in the world, offering excellent liquidity and volatility during the European trading session (8:00-16:30 GMT). The index is highly responsive to economic data releases, European Central Bank (ECB) policy decisions, and global risk sentiment.
2. GER40 Technical Analysis — August 2026
The GER40 has experienced a remarkable bull run since 2021, advancing from approximately 16,000 to current levels above 26,000 — a gain of over 60% in less than five years. This section provides a comprehensive technical analysis of the current market structure.
2.1 Current Price Action
As of August 2026, the GER40 is trading near 26,300, having recently set a new all-time high at 26,504. The index has been consolidating below this record level, forming a potential bullish flag pattern on the daily chart. A break above 26,500 would confirm the continuation of the uptrend.
The price action remains bullish overall, with higher highs and higher lows still intact. However, the recent sideways movement suggests the market is digesting recent gains before the next leg higher.
2.2 Moving Averages Analysis
The 50-day Simple Moving Average (SMA) is currently at 25,800 and rising, providing dynamic support. The 200-day SMA is at 24,700, also pointing upward. Both moving averages are well below the current price, confirming the strong bullish trend.
The Golden Cross (50-day SMA crossing above 200-day SMA) occurred in late 2023 and remains intact, a long-term bullish signal. Traders should watch for any potential bearish crossover as a warning sign of trend reversal.
2.3 Momentum Indicators — RSI, MACD, Stochastic
The Relative Strength Index (RSI) on the daily chart is currently at 58, indicating neutral momentum with a slight bullish bias. The RSI has been oscillating between 50 and 70 since March 2026, suggesting steady buying pressure without overbought conditions.
The MACD histogram remains in positive territory, with the MACD line above the signal line. This indicates that bullish momentum is still prevailing, although the narrowing histogram suggests a loss of upside momentum in the very short term.
The Stochastic Oscillator is currently at 62, moving sideways in the neutral zone. A move above 80 would signal overbought conditions, while a drop below 20 would indicate oversold conditions.
2.4 Trend Analysis — Short, Medium, Long Term
- Short-term (1H-4H): Neutral — The index is consolidating in a tight range between 26,000 and 26,500. A breakout in either direction will determine the next short-term trend.
- Medium-term (Daily): Bullish — The index remains above all key moving averages, with higher highs and higher lows intact.
- Long-term (Weekly/Monthly): Bullish — The long-term uptrend remains firmly in place, supported by strong fundamentals and positive economic data from Germany and the Eurozone.
3. Key Support and Resistance Levels for GER40
Identifying key support and resistance levels is essential for successful trading. The table below outlines the most important levels for the GER40 as of August 2026, based on recent price action and historical data.
| Level Type | Price Level | Significance | Trading Action |
|---|---|---|---|
| All-Time High | 26,504 | Record high (Aug 2026) | Watch for breakout |
| Resistance | 26,450-26,500 | Recent highs | Sell zone / breakout watch |
| Resistance | 26,200-26,300 | Psychological level | Watch for rejection |
| Pivot | 26,082 | 6 Aug low | Key support/resistance |
| Support | 26,000 | Psychological level | Buy zone |
| Support | 25,800 | 50-day SMA | Strong buy zone |
| Support | 25,500 | Major support | Buy zone |
| Support | 25,000 | Critical support | Major buy zone |
📌 Level Type indicates whether the level acts as support (buy zone) or resistance (sell zone). Significance explains why the level matters. Trading Action suggests potential strategies.
4. GER40 Trading Strategies for 2026
Based on the current technical structure, here are three proven strategies for trading the GER40 in 2026:
4.1 Breakout Strategy
Entry: Buy when the price breaks above the 26,500 resistance with strong volume and bullish candlestick confirmation (e.g., a large green candle). Alternatively, sell when the price breaks below the 26,000 support.
Stop-Loss: Place the stop-loss 50-100 points below the breakout level for long positions, or above for short positions.
Take-Profit: Target the next major level. For a bullish breakout, target 27,000 (psychological level) or 27,500.
4.2 Pullback Strategy
Entry: Buy on pullbacks to the 50-day SMA (25,800) or the 26,000 psychological level, provided the overall trend remains bullish. Look for bullish reversal patterns (pin bars, engulfing patterns) as confirmation.
Stop-Loss: Place the stop-loss 50-100 points below the support level.
Take-Profit: Target the recent highs at 26,450-26,500 or the all-time high at 26,504.
4.3 Range Trading Strategy
Entry: Buy near 26,000 support and sell near 26,450-26,500 resistance while the index remains range-bound. This strategy works best when the RSI is between 40-60 and there are no major news events.
Stop-Loss: Place the stop-loss 30-50 points outside the range boundaries.
Take-Profit: Target the opposite side of the range.
5. Complete Comparison Table: GER40 vs Other Major Indices
This table compares the GER40/DAX 40 with other major global indices, highlighting key differences in composition, performance, and trading characteristics.
| Feature | GER40 (DAX 40) | S&P 500 | FTSE 100 | Nikkei 225 |
|---|---|---|---|---|
| Country | Germany | USA | UK | Japan |
| Number of Stocks | 40 | 500 | 100 | 225 |
| 2026 Performance | +25% (est.) | +12% (est.) | +8% (est.) | +15% (est.) |
| Top Sector | Industrials | Technology | Energy | Technology |
| Trading Hours (GMT) | 8:00-16:30 | 14:30-21:00 | 8:00-16:30 | 0:00-6:00 |
| Volatility | Medium | Medium-High | Low-Medium | Medium |
| Correlation with USD | Negative | Negative | Negative | Negative |
| Best Trading Time | European session | US session | European session | Asian session |
📌 Performance is estimated for 2026 year-to-date. Correlation with USD indicates that these indices typically move inversely to the US Dollar.
6. What Moves the GER40? — Key Fundamental Drivers
The GER40 is influenced by a combination of macroeconomic factors, corporate earnings, and global risk sentiment. Here are the most important drivers:
6.1 ECB Monetary Policy
European Central Bank (ECB) interest rate decisions have a direct impact on the GER40. Higher rates tend to strengthen the Euro but can weigh on export-oriented German companies. Conversely, lower rates support equity valuations but may weaken the currency.
The ECB’s current policy stance, combined with the Federal Reserve’s actions, creates a complex interplay that traders must monitor closely.
6.2 German Economic Data
Key economic indicators that move the GER40 include:
- GDP Growth — Germany’s economic expansion directly correlates with corporate earnings.
- Manufacturing PMI — Germany’s industrial sector is a major driver of the index.
- Export Data — As Europe’s largest exporter, German trade figures are critical.
- Unemployment Rate — Consumer spending power and domestic demand.
6.3 Global Risk Sentiment
The GER40 is highly sensitive to global risk appetite. During “risk-on” periods, investors buy German equities; during “risk-off” periods, they sell. Geopolitical events, trade tensions, and global economic slowdowns can all trigger sharp movements.
6.4 Corporate Earnings Season
Earnings reports from DAX 40 constituents like SAP, Siemens, and Allianz can drive significant index movements. Positive surprises often lead to sharp rallies, while disappointments can trigger sell-offs.
7. Frequently Asked Questions
What is the difference between GER40 and DAX 40?
GER40 and DAX 40 refer to the same index — Germany’s benchmark stock index tracking the 40 largest companies. Different brokers use different symbols (GER40, DAX 40, DE40) but they all track the same underlying index.
What time frame is best for trading GER40?
The best time frame depends on your trading style. Scalpers use 1M-15M charts, day traders use 1H-4H, and swing traders use Daily/Weekly charts. The most active trading hours are during the European session (8:00-16:30 GMT).
What indicators work best for GER40?
RSI, MACD, Moving Averages (50, 100, 200), and Fibonacci retracements are among the most effective indicators for GER40 analysis.
Can I trade GER40 on MT4 and MT5?
Yes, most brokers offer GER40/DAX 40 trading on both MetaTrader 4 (MT4) and MetaTrader 5 (MT5) platforms. MT5 offers additional timeframes and advanced backtesting features for index trading.
What are the key support and resistance levels for GER40?
As of August 2026, key levels include resistance at 26,450-26,500 (recent highs), support at 26,000 (psychological), and major support at 25,500-25,800.
How does the ECB affect the GER40?
The European Central Bank’s monetary policy decisions directly impact the GER40 through interest rates, currency valuation, and overall market sentiment. Higher rates can strengthen the Euro but may weigh on export-oriented German companies.
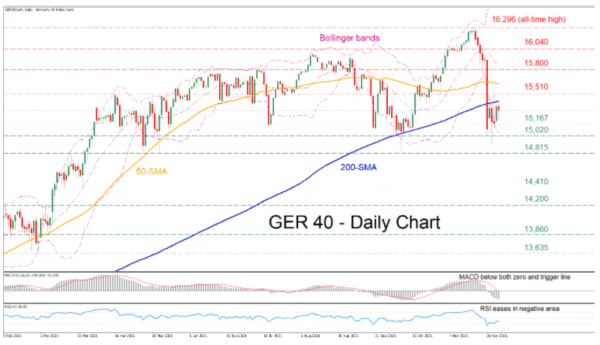
📈 Historical context: Understanding today’s levels requires knowing where the GER40 has been. Review our analysis of when the GER40 broke above daily resistance at 15,840 in December 2021 — a pivotal moment that marked the beginning of the current bull run and set the stage for the record highs we see today.
📊 Cross-market perspective: While the GER40 consolidates near all-time highs, other instruments show different dynamics. Explore our technical analysis of GBPJPY moving sideways after its December rally — a contrasting example of range-bound price action that demonstrates how different markets behave under similar macroeconomic conditions.

 Signal2forex.com - Best Forex robots and signals


