S&P 500 technical analysis
- S&P500 is bullish.
- The price might reject off 88.6.
- The market is at important level.
- It will bounce or reject.
Daily chart S&P 500
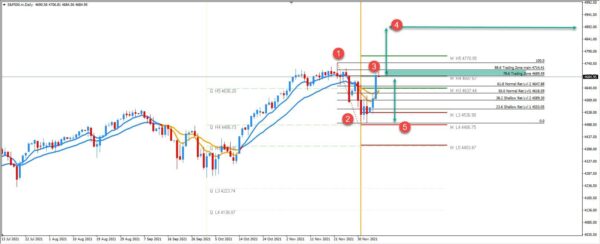
- Pinbar high.
- Swing low.
- The entry zone.
- Target High.
- Target Low.
The price is currently bouncing from the zone. We could see a continuation up or a move down depending on the daily close. The price is at the crossroads 4690-4715 is the trading zone. A bounce off the zone should be going towards 4892 while the drop might aim towards 4486. Watch the daily close and all levels in between. The SP500 also correlates very strongly to AUDJPY so watch also the movement on the AUDJPY pair. Equities generally highly correlate to JPY which is the risk on and risk off gauge. The daily close on the SP500 is important. Above or below the trading zone for the next direction.
 Signal2forex.com - Best Forex robots and signals


