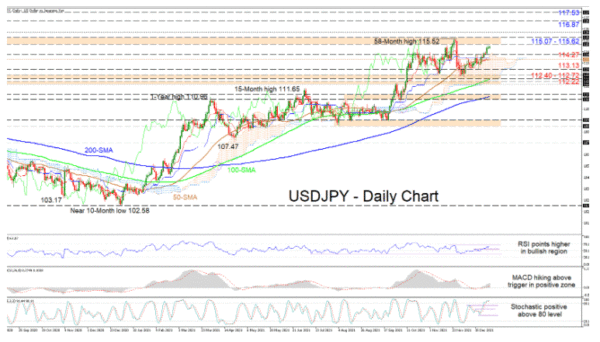
USDJPY is ready to confront the resistance section of 115.07-115.62 after the price bounced within the 112.40-112.72 support base and subsequently found footing off the Ichimoku cloud’s upper band. The simple moving averages (SMAs) are maintaining a northbound trajectory, backing the ascent.
Currently, the Ichimoku lines are not indicating a definitive price direction, while the short-term oscillators are promoting advances in the pair. The MACD, north of the zero mark, is climbing above its red trigger line, while the RSI is ascending in the bullish region. Moreover, in the overbought territory, the stochastic lines are promoting upside drive in the pair, as the %K line has yet to hint of any waning in bullish forces.
If the price sustains its current path, resistance could originate from the toughened 115.07-115.62 barricade shaped by the rally peaks from January and March 2017, as well as the fresh near 5-year high of 115.52. If the one-year uptrend resumes, the 116.00 psychological number could draw attention. From here, any additional gains in the pair may encourage buyers to pilot for the 116.87 and 117.53 highs, achieved in January 2017.
Otherwise, if the 115.07-115.62 barrier curbs the extension of the one-month rally, sellers could face initial downside limitations between the 114.27 obstacle and the 50-day SMA at 113.89. However, retreating deeper into the cloud, the 113.13 low could come into play ahead of the 112.40-112.72 support border. It’s worth pointing out that either the above mentioned border, or the adjacent support band from the February 2020 rally peak of 112.22 until the 112.00 handle would need to remain intact to avoid throwing any doubt into the broader uptrend.
Summarizing, USDJPY is sustaining a bullish bias above the SMAs and the 112.40-112.72 support barrier.


 Signal2forex.com - Best Forex robots and signals


