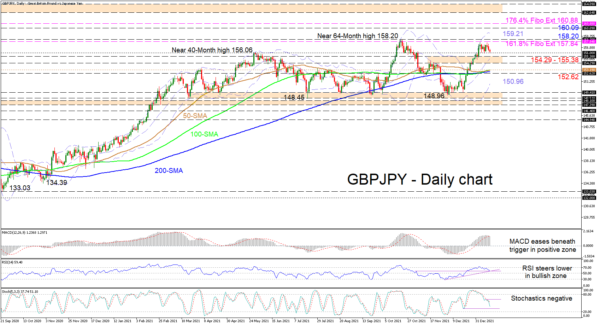
GBPJPY is consolidating between the 156.00 handle and the 157.84 level, which is the 161.8% Fibonacci extension of the down leg from 144.94 until 124.00. The simple moving averages (SMAs) are reflecting a fragile neutral-to-bullish trend in the pair.
That said, the short-term oscillators are indicating that bearish forces are growing. The MACD, deep in the positive region, has faded below its red trigger line, while the RSI is sliding in the bullish territory and is about to face a key support level. The negatively charged stochastic oscillator is promoting a bearish pullback in the pair. Currently, it appears that the 156.00 level may be acting as the immediate barrier, which could restart a price course either lower or higher.
If sellers maintain their slight advantage and dip the price beneath the 156.00 mark, prompt support could arise at the neighbouring 154.29-155.38 border. If this fortified boundary fails to provide footing for buyers, the price may then target a support area formed between the 50-day SMA at 153.19 and the inside swing high of 152.62. Should the SMAs struggle as well to dismiss the price from retracing further, the lower Bollinger band at 150.96 could come into play.
Otherwise, if positive traction develops off the 156.00 level, the 161.8% Fibo extension of 157.84 and the more than five-year high of 158.20 could contest a positive breakout of the sideways market that has gripped the pair for around three-months. If the one-month rally extends higher, the upper Bollinger band at 159.21 may be challenged before buyers tackle the critical 160.09 high from back in June 2016, where the price previously collapsed 16% in a day. Overshooting this, upside momentum could then be tested by the 176.4% Fibo extension of 160.88.
Summarizing, GBPJPY is exhibiting a neutral-to-bullish tone as it holds near the upper end of the three-month trading range. That said, a push below 156.00 or above 158.20 may restart price volatility in the pair.


 Signal2forex.com - Best Forex robots and signals


