An Introduction to Trend Trading
Of the three market conditions, trends are often the most sought after. This is an attractive market condition for traders for a number of reasons, key of which is one of biasing.
The future is uncertain and that will always remain the case. But, when the trader observes a trend, there’s potential for that to continue. And when there’s a reason for that trend to exist, such as the representative Central Bank is hiking rates or perhaps it’s just inflation numbers ticking higher, causing traders to expect the Central Bank to hike rates down the road; and that rationale could logically be projected into further price gains if those trends with inflation continue, as well.
Recommended by James Stanley
Introduction to Forex News Trading
But as with many other facets of trading, trend is a relative type of grading, and there’s a few different ways to denote trends, each which have their own pros or cons. But the general goal with trend trading for traders is to observe a strong trend and then to hypothesize ways of getting trades triggered in the direction of that move. And the age old logic of ‘buy low, sell high’ is often a goal incorporated by traders during such situations.
How to Define Trend – Time Frames
This is a key sticking point for new traders but if you observe a trend on a five minute chart, it may be completely divorced from what’s going on with the hourly or daily chart. And further, even for intermediate traders that are tracking a trend on a daily chart, well that may be different than the trend on the weekly chart which is often used for swing strategies.
So first things first, traders should assure that they’re evaluating markets and setups on an apples-to-apples basis, and one way of moving towards this end is affixing the time frames that are being used in the strategy.
This can be particularly important for trend trading strategies as the trader is often looking to ‘buy low, sell high’ by evaluating a trend and then looking at a shorter-term chart in order to trigger the entry.
If you’d like to get more familiar with which chart time frames traders will often use for varying approaches, we have an entire installment on this topic in our education section.
Introduction to Technical Analysis
Time Frame Analysis
Recommended by James Stanley
For purposes of this article, we’re going to default to the ‘swing trader’ approach which often looks to daily charts for trends and four hour charts for more specific strategy information that can be used for entry.
How to Define Trend – Methodology
Once the charting time frames have been decided on, we can move on to methodology. There are numerous ways that traders can look to define trend but in this article we’re going to focus on some of the more common.
Moving Averages
This is probably one of the more common ways of going about grading trends and there’s even a few popular moving averages that traders will use. The 200 day moving average is of course one of the more common and this is a popular indicator that many traders will keep on their charts, both for experienced and new traders.
The downside of the 200 day moving average is that it may not be very actionable given the proximity of price. If a strong trend develops, price can continue to climb above that moving average for a very long time. And when the trend does finally calm and price has pulled far away from that indicator, there could be an extended period of time before price re-crosses the moving average. So, while this can be a strong trend filter and is very popular with a number of technicians, it also may not be as usable as what many traders are looking for in terms of trend diagnostics.
Recommended by James Stanley
The Fundamentals of Trend Trading
This has motivated traders to utilize shorter-term moving averages, such as 20, 50 or 100 periods; allowing for greater gradience in trend trading. In the below graphic, I’ve added moving averages at 20, 100 and 200 periods, and you can see how the faster indicators (with lower input values) respond more quickly to near-term price movements. While the 200 day moving average in blue is relatively slow to respond.
EUR/USD with Moving Averages Applied
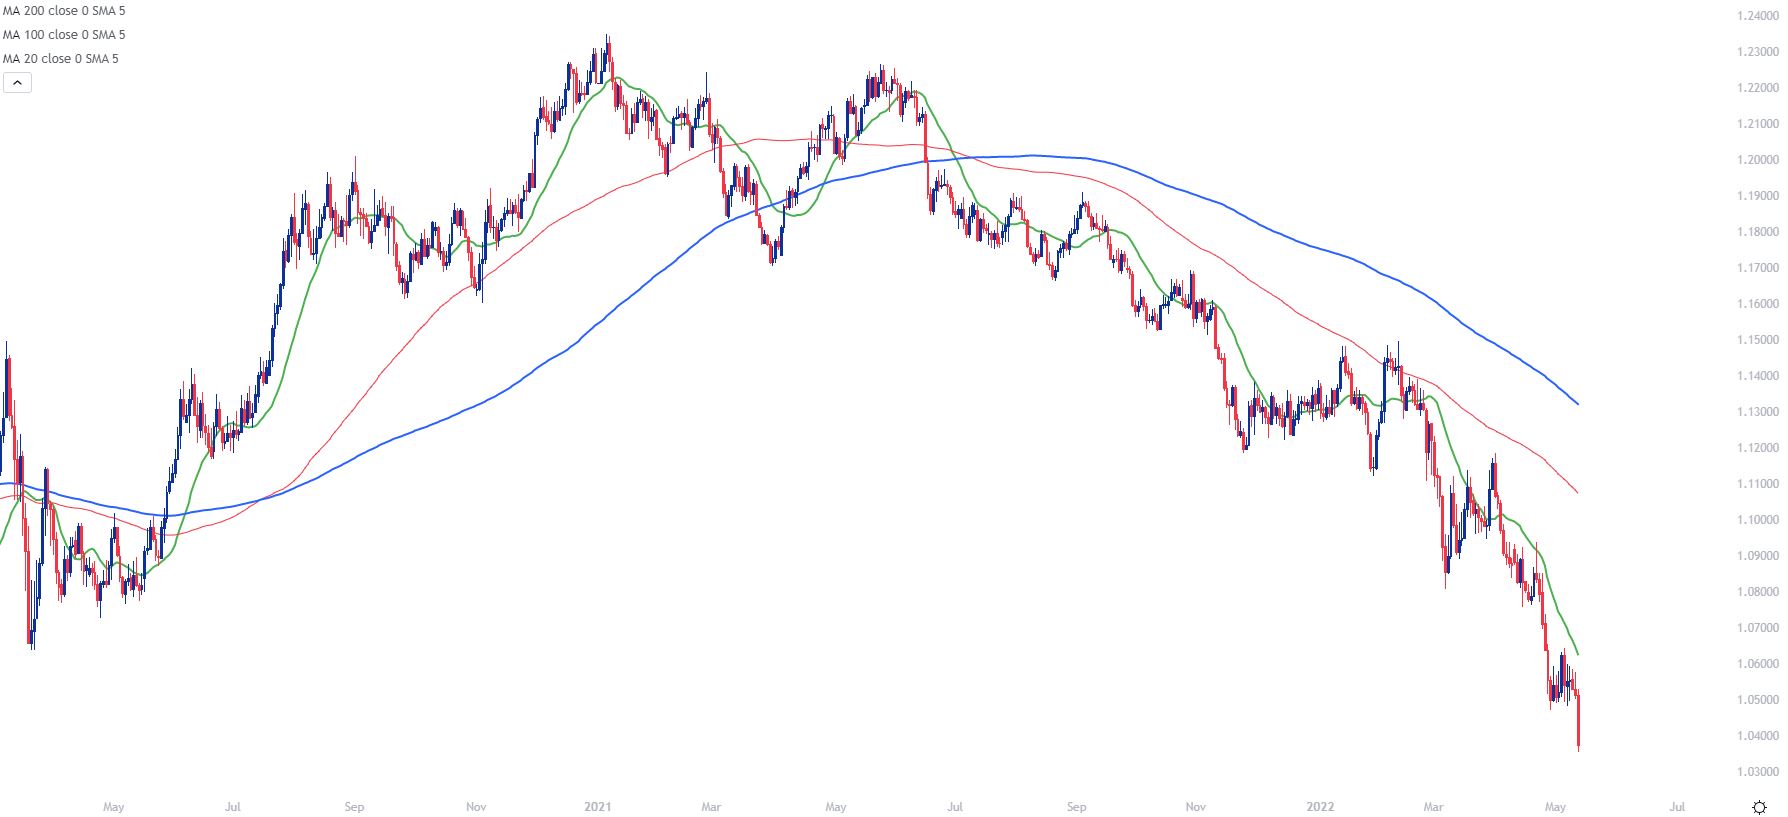
Chart prepared by James Stanley
Moving Average Crossovers
Extended that logic, traders can then plot multiple moving averages in the aim of grading momentum. If, for instance, the trader is using a 50 period moving average, that indicator should react much more quickly to a new price move than a longer moving average, such as 200 periods. The very act of the 50 period moving average crossing the 200 period moving average can be seen as a trend tool, pointing to the possibility of continuation once that crossover takes place.
These are incredibly popular and you’ve likely seen then referenced on television or in the media. The 50 period moving average crossing up and over the 200 period moving average is called the ‘golden cross,’ while the opposite move of the 50 period moving average crossing down and under the 200 period moving average is called the ‘death cross.’
Similarly, these indications can be used as trend filters with the ‘golden cross’ functioning as a bullish indicator while the death cross functions as a bearish indicator which traders can then use to help determine entries and exits.
Introduction to Technical Analysis
Moving Averages
Recommended by James Stanley
On the below chart of GBP/USD, I’ve added red circles around ‘death crosses’ and blue circles around ‘golden crosses.’ Notice that when markets continue to trend, the signals from that moving average crossover can work out well. But, on the other side, when markets are somewhat choppy, as they were in the left side of the below graphic, those signals can work out badly.
GBP/USD Daily Chart: Golden and Death Crosses Identified
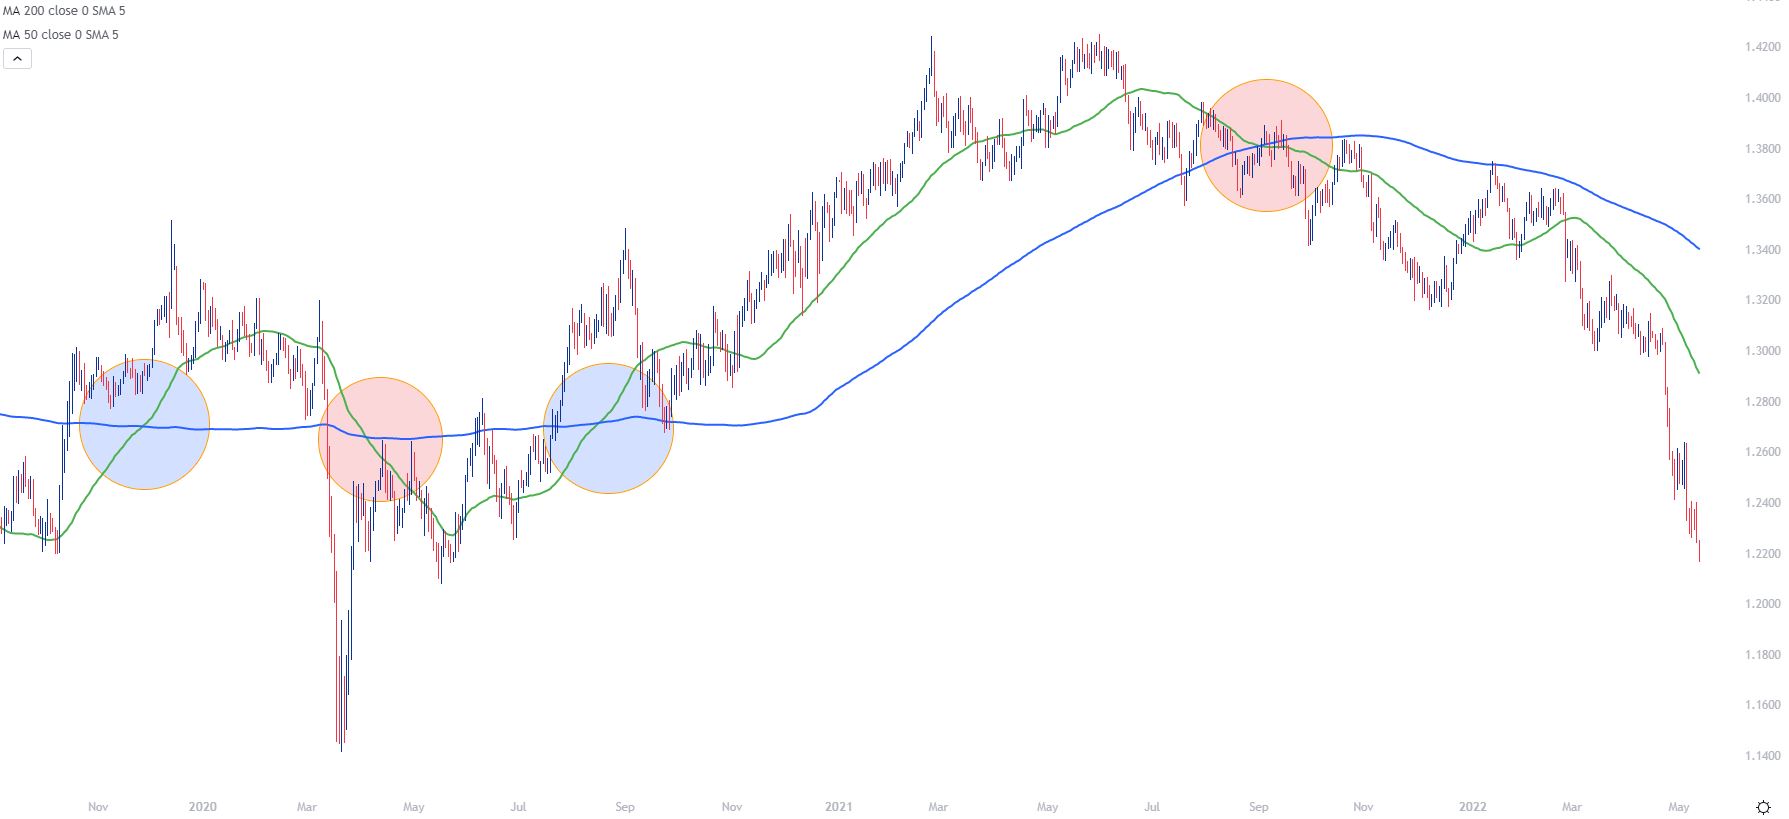
Chart prepared by James Stanley
Price Action
Price action is a bit more subjective than moving averages but, similarly, this is a common method of trend diagnoses. Uptrends will show a series of higher-highs and higher-lows. While downtrends will often display the opposite, lower-lows and lower-highs.
We look at this in greater depth in our price action trends article, which can be found in our price action sub-module.
GBP/USD Daily Price Chart
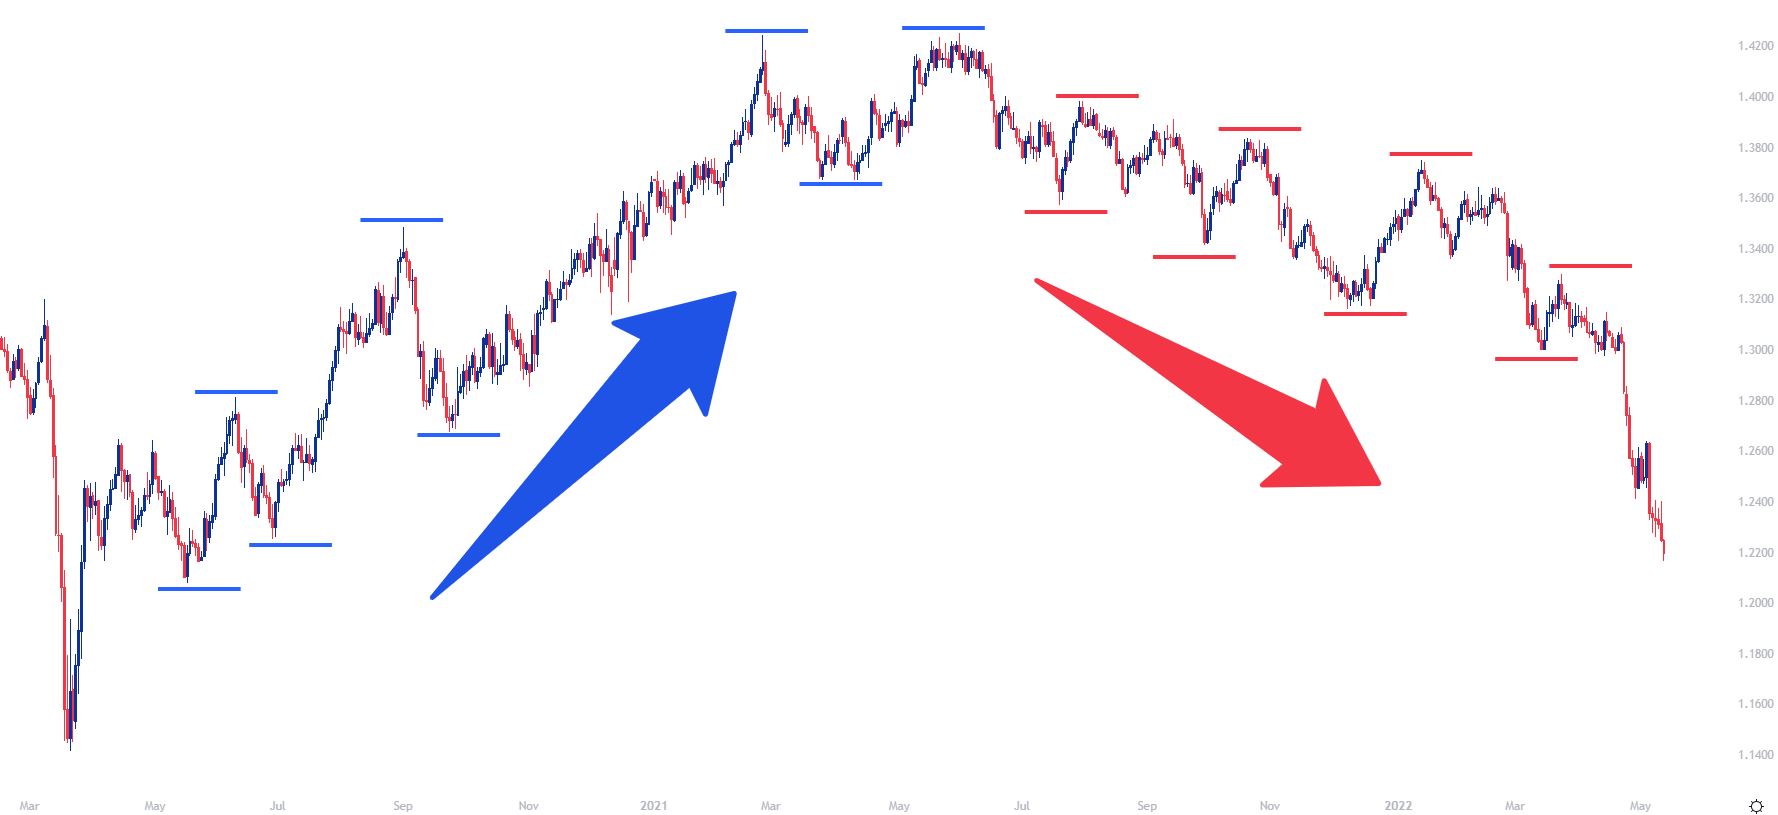
Chart prepared by James Stanley
 Signal2forex.com - Best Forex robots and signals


