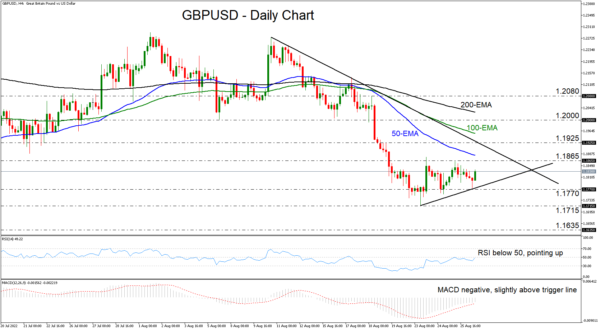
GBPUSD traded higher on Friday, after hitting support at 1.1770. The pair has been printing higher lows since August 23, but it is still trading below the downtrend line drawn from the high of August 10, as well as below all the moving averages. This implies that the pair is in a corrective phase within a bigger downtrend.
The oscillators suggest some further recovery before the bears take the reins again. The RSI is fractionally below 50, but it is pointing up and appears ready to move above that equilibrium level, while the MACD, although negative, lies above its trigger line, pointing up as well.
The move signaling a downtrend continuation may be a dip below 1.1770. This will confirm a forthcoming lower low on the 4-hour chart, and may initially target the low of August 23, at 1.1715. If there are no buyers to be found near that zone either, then a break lower could set the stage for declines towards the 1.1635 territory, defined as a support by the low of March 25, 2020.
On the upside, a break above the aforementioned downtrend line and the 1.1925 zone may wake up more bulls, who could shoot for the psychological round figure of 1.2000. That zone acted as a key support area between August 5 and 18. If they do not abandon the push after hitting that zone, then they could decide to extend the advance towards the peak of August 18, at around 1.2080.
In brief, GBPUSD has been forming higher lows recently, but it remains below a downtrend line. This implies that the pair is in a corrective phase within a broader downtrend. That trend may be reignited upon a dip below the 1.1770 support.
 Signal2forex.com - Best Forex robots and signals


