After forming a high on February 20, 2019 at $1346.75, Gold has continued to correct lower. The structure of the pullback from February 20 high appears incomplete. This suggests further downside is possible. The decline is unfolding as a zigzag Elliott Wave structure where the yellow metal is currently within wave C. In a zigzag, typically wave C is equal in length to wave A. A 100% – 123.6% Fibonacci extension in wave C can see the metal reaching $1242.31 – $1258.04 before finding support.
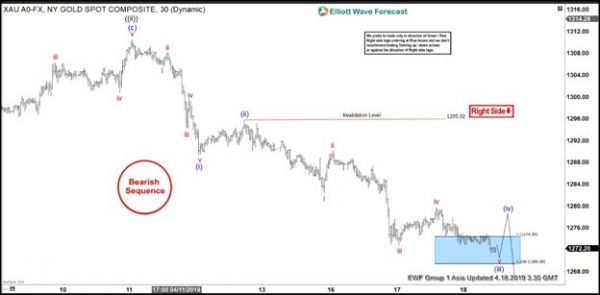
The internal of wave C subdivides as an impulse where wave ((ii)) ended at $1310.60 as the chart below shows. The yellow metal then extends lower within wave ((iii)) of C which also subdivides as an impulse of lesser degree. Down from $1310.6, wave (i) ended at $1289.4 and wave (ii) ended at $1295.80. Expect wave (iii) to end soon and the yellow metal to bounce in wave (iv) to correct the decline from $1295.92 before the metal extends lower again. We do not like buying Gold in the shorter cycle and still favor more downside as far as pivot at $1295.92 remains intact.
1 Hour Gold Elliott Wave Chart Asia Update


 Signal2forex.com - Best Forex robots and signals


