
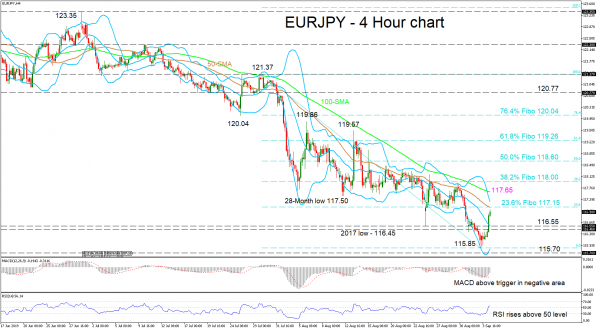
EURJPY bulls took back five days of extended losses which stretched below the 2017 low of 116.45, moving the price above the mid-Bollinger band.
The momentum indicators also reflect an increase in bullish directional momentum in the very short-term. The MACD has distanced itself above its red trigger line in the negative region, while the RSI moved out of the oversold area and crossed the 50-neutral level into bullish territory. Another bullish signal occurred as the price moved above the mid-Bollinger band. Nevertheless, the downward sloping simple moving averages (SMAs) on the four-hour chart warn that the bigger negative picture overwhelms.
If the 117.15 level endures upside pressure, which is the 23.6% Fibonacci retracement level of the down-wave from 121.37 to 115.85 and where the 50-period SMA coincides, the price could drop to test the support region of 116.55 – 116.45 where the mid-Bollinger band currently lies. If the bears dominate, the recent trough of 115.85 could see a revisit, before reaching the slightly lower support of 115.70.
If the bulls remain in control and breach the durable resistance of 117.15, moving higher towards the swing high of 118.00, the pair could stagger at the 100-period SMA presently at 117.65. Climbing further, resistance could next come from the 50.0% Fibo of 118.60, and if the rally continues, the 61.8% Fibo of 119.26 could also play out.
Summarizing, the medium-term bearish sentiment wins the battle. To turn the picture to neutral, the bulls would need to shift above 120.04, but overcoming 121.37 could confirm it.
Recommend professional Forex robots

 Signal2forex.com - Best Forex robots and signals


