
Extended Regression StopAndReverse – Free MT4/MT5 Indicator
$0.00
System: Metatrader 4/5
Timeframe: any
Chart: any
How to download: Click Free download and checkout. Then enter your details and place order. You’ll receive download link automatically thereafter.
Description
📑 Table of Contents
- 1. What Is the Extended Regression StopAndReverse Indicator?
- 2. Key Features of Extended Regression Indicator
- 3. Extended Regression Indicator for MetaTrader 4 (MT4)
- 4. Extended Regression Indicator for MetaTrader 5 (MT5)
- 5. Technical Specifications
- 6. Understanding the Indicator Components
- 7. How to Use Extended Regression StopAndReverse
- 8. How to Install Extended Regression Indicator in MT4 & MT5
- 9. Extended Regression Indicator Settings and Configuration
- 10. Extended Regression Indicator Review: Pros and Cons
- 11. Comparison Table: Extended Regression vs Other Regression Indicators
- 12. Frequently Asked Questions
1. What Is the Extended Regression StopAndReverse Indicator?
The Extended Regression StopAndReverse indicator is a sophisticated free forex indicator designed for MetaTrader 4 and MetaTrader 5 that combines linear and parabolic regression analysis with adaptive stop and reversal levels. Created by the developer Oles, this indicator has been recognized by many users since its original publication in 2007 and continues to be a valuable tool for traders seeking to understand trend dynamics and potential reversal points.
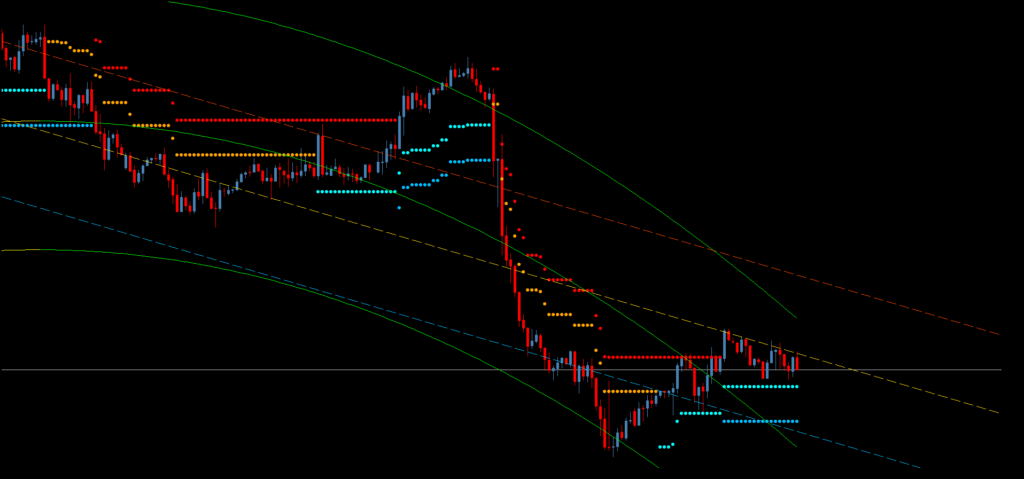
At its core, the indicator automatically determines the timeframe upon startup, calculates two types of regression on the current timeframe, and computes the root-mean-square deviation of the price on the current range. The indicator displays several key visual components:
- A golden regression line — a first-degree regression line that shows the direction and strength of the current true trend. The greater the angle to the horizontal, the stronger the trend.
- Support and resistance lines — located parallel to the trend at a distance based on the root-mean-square deviation with corresponding Fibonacci coefficients.
- Adaptive “stop” and “stop/reversal” levels — displayed as colored dots above and/or below the price, calculated using a special algorithm based on the root-mean-square deviation and Fibonacci coefficients.
- A non-linear regression channel — using parabolic regression (2nd degree) to predict the nearest future price movement.
Despite its complex mathematics, the indicator does not load the CPU at all and does not require any special computer resources.
2. Key Features of Extended Regression Indicator
The Extended Regression StopAndReverse indicator is packed with features designed to give you a comprehensive view of market trends and potential reversal points:
- Dual Regression Analysis — Combines linear (1st degree) and parabolic (2nd degree) regression for a complete picture of price dynamics
- Golden Trend Line — First-degree regression line showing the direction and strength of the true trend
- Support & Resistance Channel — Parallel lines based on root-mean-square deviation with Fibonacci coefficients
- Adaptive Stop/Reversal Levels — Color-coded dots (blue below, red above) indicating stop and stop/reversal levels
- Non-Linear Regression Channel — Parabolic regression channel for predicting near-future price movement
- Automatic Timeframe Detection — The indicator automatically determines the timeframe at startup
- Instantaneous Value Reversal — When price breaks through stop levels, the indicator reverses support/resistance levels
- Low CPU Usage — Despite complex calculations, the indicator is lightweight and fast
- Works on Any Timeframe — From M1 to Monthly charts
- Works on Any Symbol — Forex, commodities, indices, and more
- Compatible with MT4 and MT5 — Separate versions for both platforms
- Completely Free — No hidden fees, no limitations
3. Extended Regression Indicator for MetaTrader 4 (MT4)
The MT4 version of the Extended Regression StopAndReverse indicator is fully compatible with MetaTrader 4, the world’s most popular trading platform. It integrates seamlessly into the MT4 environment and can be used alongside any other indicators or expert advisors.
Key benefits of the MT4 version:
- Runs on all MT4 builds (including the latest versions)
- Supports all MT4 timeframes (M1 to MN1)
- Can be combined with other MT4 indicators for confirmation
- Lightweight and fast — does not slow down your platform
- Easy to install — copy to the MQL4/Indicators folder
4. Extended Regression Indicator for MetaTrader 5 (MT5)
The MT5 version of the Extended Regression StopAndReverse indicator is optimised for MetaTrader 5, the next-generation trading platform. It takes full advantage of MT5’s advanced features while maintaining the same core functionality and accuracy as the MT4 version.
Key benefits of the MT5 version:
- Optimised for MT5’s multi-threaded architecture
- Supports all MT5 timeframes and symbols
- Works with MT5’s advanced charting and analysis tools
- Compatible with MT5’s automated trading features
- Installation is simple — copy to the MQL5/Indicators folder
5. Technical Specifications
Below is a complete breakdown of the Extended Regression StopAndReverse indicator’s technical specifications.
| Specification | Details |
|---|---|
| Indicator Name | Extended Regression StopAndReverse |
| Type | Regression Analysis Indicator |
| Platform | MetaTrader 4 (MT4) & MetaTrader 5 (MT5) |
| Regression Types | Linear (1st degree), Parabolic (2nd degree) |
| Key Components | Golden trend line, Support/Resistance channel, Non-linear channel, Adaptive stop/reversal levels |
| Timeframe | Any (auto-detected) |
| Currency Pairs | Any (works best with majors; yen pairs may have issues) |
| Chart Type | Any |
| Signal Display | Colored dots (blue below, red above) |
| Stop Levels | Adaptive “stop” and “stop/reversal” levels |
| Channel Calculation | Root-mean-square deviation + Fibonacci coefficients |
| Auto-Recalc | Yes (on each new bar) |
| CPU Usage | Low |
| License | Free |
| Price | $0.00 |
📌 All settings can be customised in the indicator’s input parameters to match your trading style and preferences.
6. Understanding the Indicator Components
The Extended Regression StopAndReverse indicator consists of several key components that work together to provide a comprehensive view of market dynamics.
The Golden Regression Line (Trend Line)
The golden regression line is a first-degree regression line that shows the direction and state of the current true trend on the selected timeframe. The greater the angle to the horizontal, the stronger the trend. By observing the position of the price relative to this line, you can make conclusions about the currency pair’s status. For example, if the line is pointing upwards and the price is below it, a small retracement has likely ended recently, and the price should naturally move above the regression line within the continuation of the trend.
Support and Resistance Channel
The support and resistance lines are located parallel to the trend at a distance from the golden line. They are plotted based on the value of the root-mean-square deviation on the calculated range with the corresponding Fibonacci coefficient. These are valid linear thresholds that help identify key price levels.
Non-Linear Regression Channel
The non-linear regression channel uses the specified regression coefficient (parabolic regression by default, coefficient 2) to calculate and display a channel that changes dynamically over time. This channel is necessary for predicting the nearest future and also serves to display valid support and resistance levels. For example, if the non-linear regression channel bends and crosses the golden line of an uptrend from above, this signals exhaustion — a retracement or even a trend change is expected. If it crosses from below, this signals an increase in trend strength.
Adaptive Stop and Stop/Reverse Levels
Using the value of the root-mean-square deviation and the corresponding Fibonacci coefficients, the indicator calculates the values of the adaptive “stop” and “stop/reversal” levels for the current price. These levels are displayed by colored dots above and/or below the price:
- Blue dots are drawn below the price — brighter ones indicate “stop”, darker ones indicate “stop/reversal”
- Red dots are drawn above the price — also displaying stop and reversal levels
For any price at any bar, the indicator always displays only two instantaneous value levels, not all four. This helps in making the corresponding conclusions about the state of the trend.
Automatic Reversal on Breakout
In case of a true breakout of one or both stop levels — when the closing price of the bar exceeds the corresponding level — the indicator displays this event by reversing the instantaneous values. For example, if those were resistance levels before a breakout, the indicator draws instantaneous support levels instead. This signals at least a short-term change of the trend by a small retracement.
7. How to Use Extended Regression StopAndReverse
The Extended Regression StopAndReverse indicator is designed to be intuitive and powerful. Here are the key guidelines for using it effectively.
Reading the Signals
- Trend Direction: The golden regression line shows the overall trend direction. An upward-sloping line indicates a bullish trend; a downward-sloping line indicates a bearish trend.
- Trend Strength: The angle of the golden line relative to horizontal indicates trend strength — the greater the angle, the stronger the trend.
- Stop/Reversal Levels: Blue dots below price (stop levels) and red dots above price (stop/reversal levels) indicate key levels where the trend may pause or reverse.
- Non-Linear Channel: The bending of the non-linear regression channel relative to the golden line can signal exhaustion or strengthening of the trend.
Entry Rules
- Trend Continuation: Look for entries when the price is above the golden line in an uptrend or below it in a downtrend, and the non-linear channel crosses from below (for uptrend) or above (for downtrend).
- Reversal Signals: Consider entries when the non-linear channel crosses the golden line from above (signaling exhaustion) or from below (signaling strengthening).
- Stop/Reverse Confirmation: Use the colored dots to confirm potential reversal points — when price breaks through a stop level, expect a potential reversal.
- Multi-Timeframe Analysis: Always check higher and lower timeframes to confirm the situation.
Exit Rules
- Take Profit: Set your take profit at the support or resistance channel lines, or at the non-linear regression channel boundaries.
- Stop Loss: Place your stop loss just beyond the stop/reversal levels indicated by the colored dots.
- Exit Signal: Exit when the price breaks through a stop level and the indicator reverses the instantaneous values.
8. How to Install Extended Regression Indicator in MT4 & MT5
Installing the Extended Regression StopAndReverse indicator is quick and straightforward. Follow the steps below for your specific platform.
Installation for MetaTrader 4 (MT4)
- Download the indicator file from this page.
- Open your MetaTrader 4 platform.
- Go to
File → Open Data Folder. - Navigate to
MQL4 → Indicators. - Copy the indicator file into the Indicators folder.
- Restart MetaTrader 4.
- Drag the indicator from the Navigator panel onto your chart.
Installation for MetaTrader 5 (MT5)
- Download the indicator file from this page.
- Open your MetaTrader 5 platform.
- Go to
File → Open Data Folder. - Navigate to
MQL5 → Indicators. - Copy the indicator file into the Indicators folder.
- Restart MetaTrader 5.
- Drag the indicator from the Navigator panel onto your chart.
9. Extended Regression Indicator Settings and Configuration
The Extended Regression StopAndReverse indicator offers a range of customizable parameters. Below are the recommended settings for optimal performance.
| Parameter | Recommended Value | Description |
|---|---|---|
| RegressionDegree | 2 or 3 | Degree of non-linear regression (2 = parabolic) |
| K_DeviationChannel | 2 or 3 | Deviation multiplier for channel width (not a Fibonacci coefficient!) |
| Timeframe | H1 or H4 | Recommended for trend analysis |
| Currency Pairs | Major pairs | EURUSD, GBPUSD, AUDUSD (yen pairs may have issues) |
📌 These settings are a starting point. Feel free to experiment with different values to find what works best for your trading style.
10. Extended Regression Indicator Review: Pros and Cons
Here is an honest assessment of the Extended Regression StopAndReverse indicator based on user feedback and real-world performance.
✅ Pros:
- Advanced regression analysis — combines linear and parabolic regression for comprehensive trend analysis
- Adaptive stop/reversal levels — color-coded dots provide clear visual signals
- Non-linear channel — helps predict near-future price movement
- Automatic reversal detection — indicator reverses levels on true breakouts
- Low CPU usage — despite complex calculations
- Works on MT4 and MT5 — compatible with both platforms
- Completely free — no hidden fees or limitations
- Auto-detects timeframe — no manual configuration needed
❌ Cons:
- Complex to understand — regression analysis requires some mathematical understanding
- Yen pair issues — may not work correctly on yen pairs due to decimal placement
- Requires practice — like any tool, it takes time to master
- Not a standalone system — works best with price action confirmation and multi-timeframe analysis
11. Comparison Table: Extended Regression vs Other Regression Indicators
How does the Extended Regression StopAndReverse indicator compare to other popular regression-based tools? This table highlights the key differences.
| Feature | Extended Regression StopAndReverse | Standard Linear Regression | Regression Channel |
|---|---|---|---|
| Platform | MT4 & MT5 | MT4 & MT5 | MT4 & MT5 |
| Linear Regression | ✅ Yes | ✅ Yes | ✅ Yes |
| Parabolic Regression | ✅ Yes | ❌ No | ❌ No |
| Non-Linear Channel | ✅ Yes | ❌ No | ❌ No |
| Adaptive Stop/Reverse Levels | ✅ Yes | ❌ No | ❌ No |
| Auto-Detect Timeframe | ✅ Yes | ❌ No | ❌ No |
| Fibonacci-Based Calculation | ✅ Yes | ❌ No | ❌ No |
| Color-Coded Signals | ✅ Yes | ❌ No | ❌ No |
| Free | ✅ Yes | ✅ Yes | ✅ Yes |
📌 Features may vary depending on the specific version of each indicator.
12. Frequently Asked Questions
What is the Extended Regression StopAndReverse indicator?
The Extended Regression StopAndReverse is a free regression analysis indicator for MT4 and MT5 that combines linear and parabolic regression with adaptive stop and reversal levels. It displays a golden trend line, support/resistance channel, non-linear channel, and color-coded stop/reversal dots.
Is Extended Regression indicator available for MT5?
Yes, the Extended Regression indicator is available for both MetaTrader 4 (MT4) and MetaTrader 5 (MT5). You can download the appropriate version from this page.
What is the golden regression line?
The golden regression line is a first-degree (linear) regression line that shows the direction and strength of the current true trend on the selected timeframe. The greater the angle to the horizontal, the stronger the trend.
What do the blue and red dots mean?
Blue dots appear below the price (stop and stop/reversal levels), while red dots appear above the price. Brighter dots indicate “stop” levels, and darker dots indicate “stop/reversal” levels. These are adaptive levels calculated using root-mean-square deviation and Fibonacci coefficients.
What is the non-linear regression channel?
The non-linear regression channel uses parabolic regression (2nd degree) to predict the nearest future price movement. It displays dynamically changing support and resistance levels that curve over time.
What are the recommended settings for Extended Regression?
Recommended settings include RegressionDegree of 2 or 3 (parabolic regression) and K_DeviationChannel of 2 or 3 for the channel width multiplier. H1 or H4 timeframes work best for trend analysis.
How does the indicator handle trend reversals?
When the closing price breaks through a stop level, the indicator reverses the instantaneous values — resistance levels become support levels and vice versa. This signals at least a short-term trend change or retracement.
Is the Extended Regression indicator free?
Yes, the Extended Regression StopAndReverse indicator is completely free to download and use. There are no hidden fees or limitations.
How do I install the Extended Regression indicator?
Download the indicator file, copy it to the Indicators folder in your MetaTrader directory (MQL4/Indicators for MT4 or MQL5/Indicators for MT5), restart the platform, and drag the indicator onto your chart.
What currency pairs work with Extended Regression?
The Extended Regression indicator works with any currency pair. However, it may have issues with yen pairs due to decimal placement, according to user reports. Major pairs like EURUSD, GBPUSD, and AUDUSD work best.
📉 Real‑world reversal example: The Extended Regression StopAndReverse indicator is designed to catch exactly the kind of moves discussed in our analysis of how the euro reversed directions — a practical case study showing how currency pairs can change trend, and how regression-based analysis can help you identify these turning points.
📊 Timing your entries with precision: See how the Extended Regression indicator’s stop/reversal levels can help you time entries around key market events. Our analysis of how the euro reversed ahead of the weekend demonstrates the importance of identifying trend changes — exactly what this indicator is designed to do.


 Signal2forex.com - Best Forex robots and signals


Reviews
There are no reviews yet.