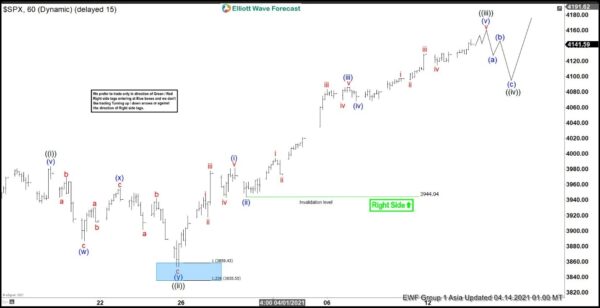
Elliott Wave View: S&P 500 (SPX) Rally Should Resume
Short term Elliott wave view in S&P 500 (SPX) suggests the rally from March 5, 2021 low is unfolding as a 5 waves impulsive structure. Up from March 5 low, wave ((i)) ended at 3983.87 and wave ((ii)) pullback ended...

WTI Futures Push Higher Within a Ranging Market
WTI oil futures have nudged back above the 60.00 mark, overstepping the Ichimoku cloud and the 100-period simple moving average (SMA) on the four-hour chart at 60.03. The commodity’s price action remains confined between the limits of 57.25 and 62.24....

EUR/AUD It’s Time For Sellers To Turn The Tables
The EUR/AUD is making a 1-2-3 hook pattern and we should see a move down. Sellers are here. After a retracement, the pair has come to W H3 camarilla pivot. However, it is not just the W H3, it is...
Gold Price Eases after Recovery Stalled at Key barrier; US CPI Eyed for Fresh Signals
Spot gold holds in red for the second straight day and extends lower after bulls failed to register a clear break above key barrier at $1755 (Mar 18 high) and generate initial signal of double-bottom formation. Elevated US Treasury yields...
USDJPY Eyes 109.00 Handle and Negative Pressures Lose Power
USDJPY’s recent pullback from the 1-year high of 110.96 seems may not have the necessary potency to successfully overpower the positive bias. The advancing 100- and 200-period simple moving averages (SMAs) are defending the positive structure, while the declining 50-period...
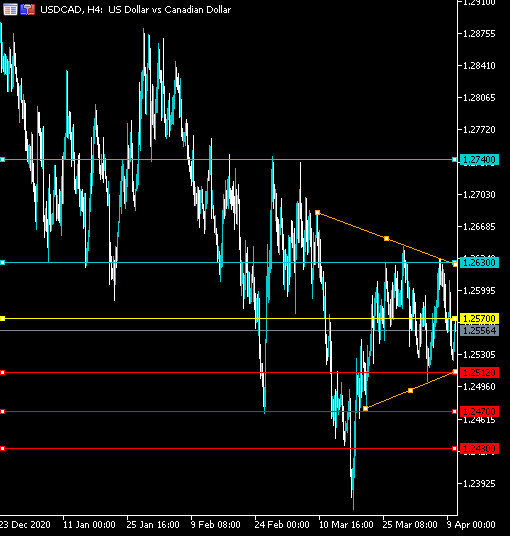
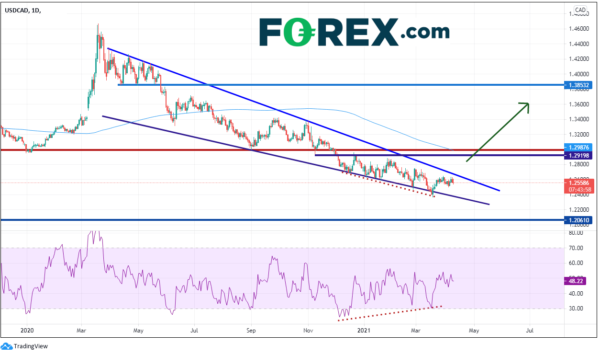
USDCAD Triangle Watch
The US dollar is still struggling for directiona against the Canadian dollar, despite last Friday’s very strong monthly jobs report from the Canadian economy. The lower time frames currently show that the USDCAD pair is trapped within a triangle pattenr,...
Canadian Jobs Data Solid: USD/CAD
The BOC will take note of the strong employment print, as they are currently the frontrunner to taper monetary policy! The Canadian Employment Change for March was +301,100 vs and expectation of +100,000 and +259,200 in February. The number was...
NZDUSD Buyers Confront Short-Term Downtrend Line
NZDUSD has consolidated over the somewhat neutral Ichimoku cloud, after slightly improving from a recently formed floor at the 0.6942 level. The falling 200- and 100-period simple moving averages (SMAs) are shielding the bearish structure, while the climbing 50-period SMA...
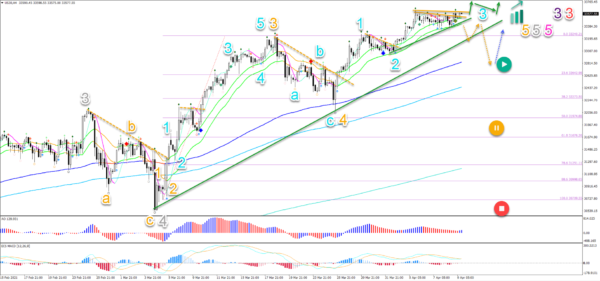
Dow Jones Index Bullish Breakout Aims At 35,000 Target
Dow Jones Index (US 30) is building a bull flag continuation chart pattern within a larger uptrend. A bullish breakout should confirm a push higher. The US 30 chart needs a break above the resistance trend lines (orange) to confirm...

GBP/USD Outlook: Bears Crack Key Supports And Look To Continue Larger Downtrend
Cable extends weakness into the fourth straight day and tested key support at 1.3670 (Mar 25 low / 100DMA) in early European trading on Friday. Bears emerged from daily cloud (cloud base lays at 1.3712) after trading within thick cloud...
Join us on Facebook
 Signal2forex.com - Best Forex robots and signals
Do you want to have such profits and charts? Click for more info…

Recommended fast VPS provider

I have been with this company for the second month with a v.11+ VPS robot with a smaller deposit and I am satisfied. For a monthly fee of $30 from the second month, I don’t have to worry about anything and just watch the earnings. The robot earns, the Skype support is excellent and you can see that it understands trading. In the future, I will definitely increase the deposit for full use of the robot to 14 pairs. I recommend Signal2forex!!!!!

From the beginning I didn’t trust the EA robot FOREX V PORTFOLIO v.11 pro 14 because I had other trades than shown in the video on the website. After a month on two demo accounts with a deposit of 2000 USD, I must say that the EA works very well!!! Monthly appreciation of both accounts approx. 30% with max DD 19%. I have to praise the developers and keep my fingers crossed for the future.

Guys are geniuses!!! I am grateful for your work!!! Everything works, they helped me install everything and there is always feedback !!! Thanks!!!

Trading education

Introduction to Basic Trendline AnalysisIn this series we will piece together the anatomy of a swing trade and discuss ... 
Daily Forex Trading Course Walkthrough: Part TwoForex Trading Course Walkthrough Talking Points: This is the second of a ten-part series in ... 
Forex Trading Truth or Lie? Uncovering the Truths of FX TradingDo you know the truths about forex trading? Traders face a barrage of information when ... 
Daily Forex Trading Course Walkthrough: Part FiveForex Trading Course Walkthrough Talking Points: This is the fifth of a ten-part series in ... |