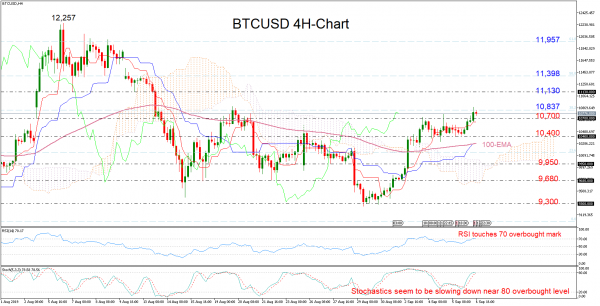
BTCUSD Exposed to Downside Corrections
BTCUSD (Bitcoin) staged a stunning upside reversal around the 9,300 support area, with the price surging back above the 100-period exponential moving average (EMA) and towards two-week highs. Buyers are currently pushing efforts to overcome the 38.2% Fibonacci of 10,837...
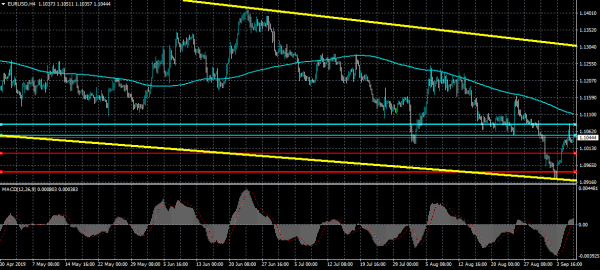
EURUSD 1.1000 Key Resistance
The euro has started to move away from the best levels of the week against the US dollar, ahead of the release of the US monthly jobs report later today. A headline number above 150,000 could see the EURUSD pair...
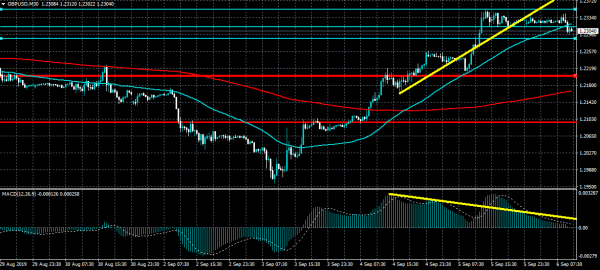
GBPUSD Bearish MACD Divergence
The British pound has moved back towards the 1.2300 support level against the US dollar after the pair found strong technical resistance from the 1.2350 level. The 30-minute time frame is showing that the recent rally has created bearish MACD...

Buying Elliott Wave Dips In 10 Year T-Note Futures
In this technical blog, we are going to take a look at the past performance of 10 Year T-Note Futures ticker symbol: $ZN_F 1-Hour Elliott wave Charts that we presented to our members. In which, the rally from October 2018 low showed...
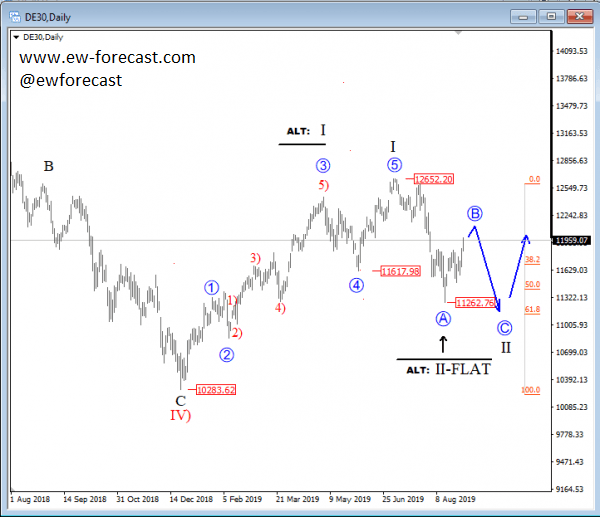
German DAX Looking Higher After A Pullback
German DAX made a five-wave recovery from the 10283 region, which we labelled it as a wave I, first leg of a bigger, bullish cycle. That said, latest bearish reaction from the 12652 area can now be sub-wave A of...
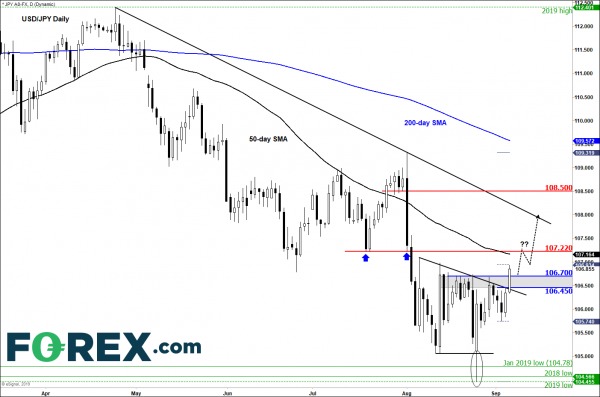
USD/JPY Technical Outlook Appears Bullish
The USD/JPY has broken above last week’s high today, thanks to positive sentiment towards risk assets in general. Sentiment has been boosted in part because of US-China trade optimism and receding no-deal Brexit risks. The UJ has been boosted further...
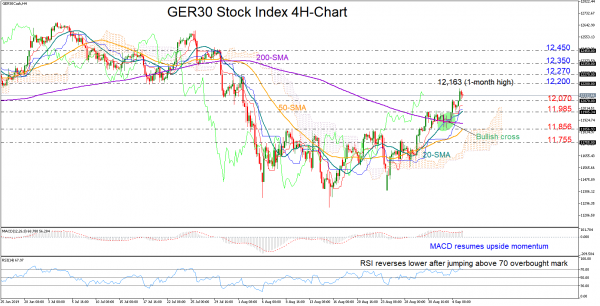
GER30 Index Gains Ground above 200-SMA; Looks Overbought
The GER30 index stepped on the 200-period simple moving average (SMA) on Wednesday and accelerated to one-month highs. While the RSI’s peak in the overbought territory suggests that the rally is overstretched and is time for a downside correction, the...

Elliott Wave View: IYR New All-Time-High In Sight
IYR is the ticker symbol for U.S. Real Estate ETF. Since the financial crash in 2009, the instrument is steadily rising and currently only $1 from breaking the 2007 all-time high. In the short term chart below, we can see...
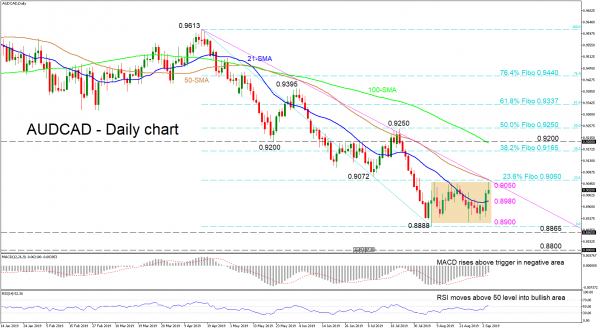
AUDCAD Capped by 0.9050 and 23.6% Fibo in a Sideways Move
AUDCAD plummeted aggressively from 0.9250 after a two-week period of producing red candles. Following the fall from the previous swing high of July 23 into a one-month trading range, the upside pressure hit a ceiling at the 0.9050 level. Positive...
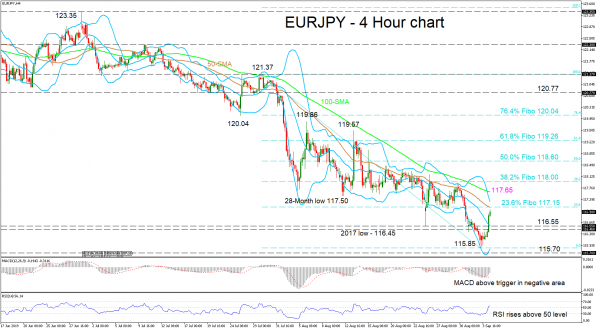
EURJPY Declines Below 2017 Low, Bulls Recoup Losses
EURJPY bulls took back five days of extended losses which stretched below the 2017 low of 116.45, moving the price above the mid-Bollinger band. The momentum indicators also reflect an increase in bullish directional momentum in the very short-term. The...
Join us on Facebook
 Signal2forex.com - Best Forex robots and signals
Do you want to have such profits and charts? Click for more info…

Recommended fast VPS provider

I have been with this company for the second month with a v.11+ VPS robot with a smaller deposit and I am satisfied. For a monthly fee of $30 from the second month, I don’t have to worry about anything and just watch the earnings. The robot earns, the Skype support is excellent and you can see that it understands trading. In the future, I will definitely increase the deposit for full use of the robot to 14 pairs. I recommend Signal2forex!!!!!

From the beginning I didn’t trust the EA robot FOREX V PORTFOLIO v.11 pro 14 because I had other trades than shown in the video on the website. After a month on two demo accounts with a deposit of 2000 USD, I must say that the EA works very well!!! Monthly appreciation of both accounts approx. 30% with max DD 19%. I have to praise the developers and keep my fingers crossed for the future.

Guys are geniuses!!! I am grateful for your work!!! Everything works, they helped me install everything and there is always feedback !!! Thanks!!!

Trading education

Introduction to Basic Trendline AnalysisIn this series we will piece together the anatomy of a swing trade and discuss ... 
Daily Forex Trading Course Walkthrough: Part TwoForex Trading Course Walkthrough Talking Points: This is the second of a ten-part series in ... 
Forex Trading Truth or Lie? Uncovering the Truths of FX TradingDo you know the truths about forex trading? Traders face a barrage of information when ... 
Daily Forex Trading Course Walkthrough: Part FiveForex Trading Course Walkthrough Talking Points: This is the fifth of a ten-part series in ... |