
WTI Oil Outlook: Bear – Trendline Capped Recovery Again; US Crude Inventories in Focus for Fresh Signals
WTI oil price eases on Tuesday, after attempts to extend Monday’s 2.15% advance repeatedly failed to clearly break above strong barriers at $56.19 (converged 200/30DMA’s) and $56.33 (bear-trendline off 15 July high at $60.96). Near-term bulls were driven by optimistic...

NZD/USD Pressure By 50– Hour SMA
Downside risks have continued to dominate the New Zealand Dollar against the Japanese Yen. The currency pair has depreciated by 0.45% in value since yesterday’s trading session. As for the near future, the exchange rate will most likely continue its...

GER30 Index Closes above the 50-SMA and Downtrend Line
The GER30 index put in a rally, pushing upwards off the 11,266 low of August 15. The price surpassed 11,580, which is the 23.6% Fibo of the down leg from 12,600 to 11,266 and near the resistance of 11,607 from...

USD/JPY Outlook: Bulls Struggle at Key Fibo Barrier
The pair stands at the front foot for the third straight day and tests again pivotal Fibo barrier at 106.68 (38.2% of 109.31/105.05 bear-leg, which repeatedly limited recovery attempts in past two weeks. Formation of 5/10DMA’s bull-cross and north-heading stochastic/RSI,...
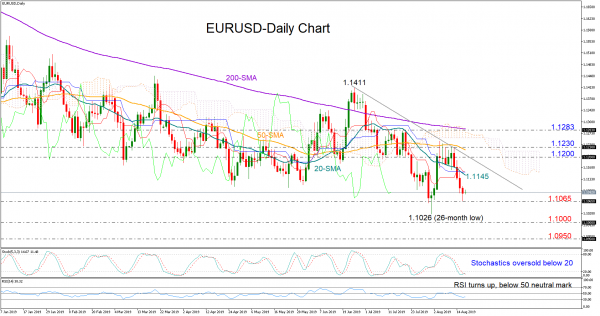
EURUSD Looks For A Rebound But Upside Could Be Limited
EURUSD surrendered most of its monthly gains and dropped below 1.1100 after finding a wall around the 50-day simple moving average (SMA) and the 1.1230-1.1250 area. Technically, the price could pause negative momentum in the very short-term as the Stochastics signal oversold conditions. The...
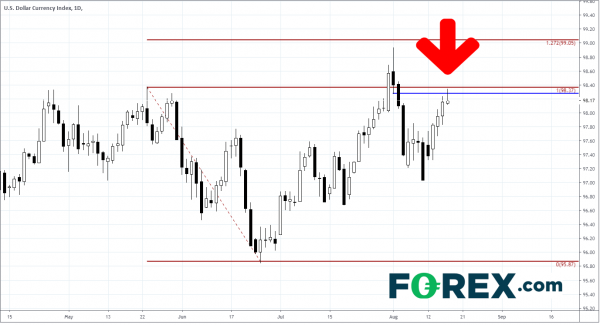
US Dollar at Key Resistance Heading into the Weekend
Today’s price action in the US Dollar (DXY) gave the markets reason for a pause in its ascent back towards the recent highs near 99.00, closing below key resistance near 98.20. On a daily candlestick chart, today’s bar was a...
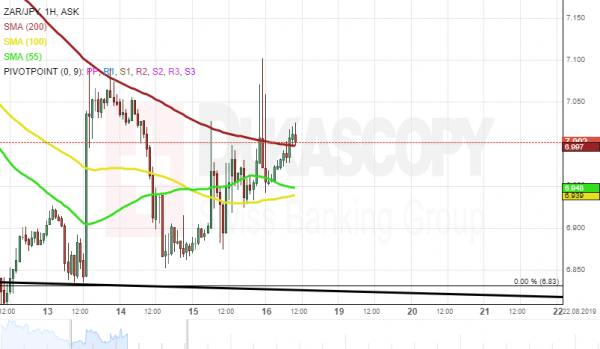
ZAR/JPY 1H Chart: Long-Term Channel In Sight
The ZAR/JPY currency pair has been trading downwards since the end of July after it reversed south from the upper boundary of the long-term descending channel at 7.81. Currently, the exchange rate is testing the lower channel line at 6.85....
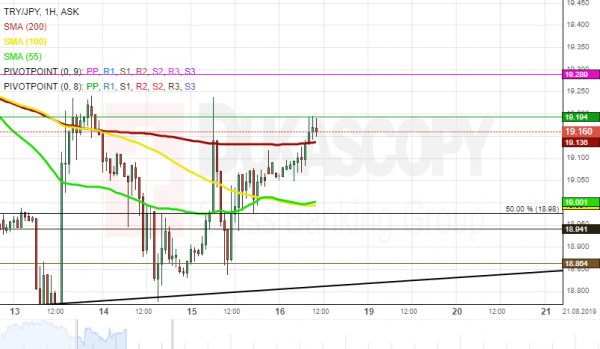
TRY/JPY 1H Chart: Two Scenarios Likely
The Turkish Lira has been appreciating against the Japanese Yen within the ascending channel since the beginning of May. As apparent on the chart, the TRY/JPY currency pair is testing its lower boundary at 18.80. From a theoretical perspective, short-term...
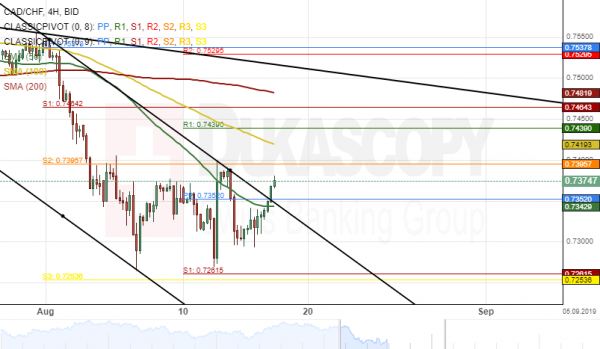
CAD/CHF 4H Chart: Could Go Down
The CAD/CHF currency pair has been trading down since the beginning of July after the pair failed to surpass the resistance level located near the 0.7606 marks. Currently, the exchange rate is trading near the upper boundary of a descending...
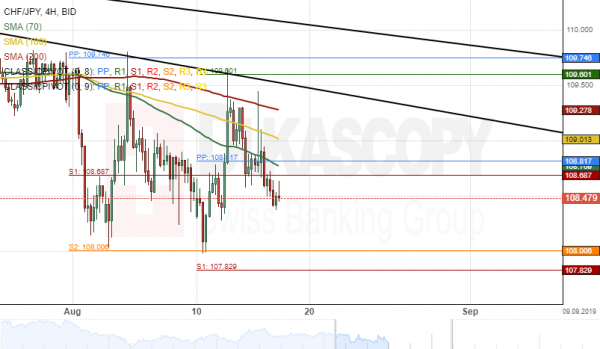
CHF/JPY 4H Chart: Trading Within Range
The CHF/JPY exchange rate has been trading between the 109.74/108.00 range since the beginning of August. The Swiss Franc depreciated about 1.53% in value against the Yen during last week’s trading sessions. As apparent on the 4(H) chart, the currency...
Join us on Facebook
 Signal2forex.com - Best Forex robots and signals
Do you want to have such profits and charts? Click for more info…

Recommended fast VPS provider

I have been with this company for the second month with a v.11+ VPS robot with a smaller deposit and I am satisfied. For a monthly fee of $30 from the second month, I don’t have to worry about anything and just watch the earnings. The robot earns, the Skype support is excellent and you can see that it understands trading. In the future, I will definitely increase the deposit for full use of the robot to 14 pairs. I recommend Signal2forex!!!!!

From the beginning I didn’t trust the EA robot FOREX V PORTFOLIO v.11 pro 14 because I had other trades than shown in the video on the website. After a month on two demo accounts with a deposit of 2000 USD, I must say that the EA works very well!!! Monthly appreciation of both accounts approx. 30% with max DD 19%. I have to praise the developers and keep my fingers crossed for the future.

Guys are geniuses!!! I am grateful for your work!!! Everything works, they helped me install everything and there is always feedback !!! Thanks!!!

Trading education

Introduction to Basic Trendline AnalysisIn this series we will piece together the anatomy of a swing trade and discuss ... 
Daily Forex Trading Course Walkthrough: Part TwoForex Trading Course Walkthrough Talking Points: This is the second of a ten-part series in ... 
Forex Trading Truth or Lie? Uncovering the Truths of FX TradingDo you know the truths about forex trading? Traders face a barrage of information when ... 
Daily Forex Trading Course Walkthrough: Part FiveForex Trading Course Walkthrough Talking Points: This is the fifth of a ten-part series in ... |