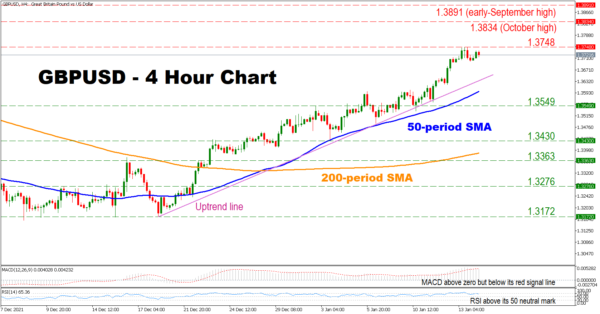
GBPUSD Climb Remains Intact Amid Lingering Bullish Forces
GBPUSD has staged a spectacular uptrend movement from late December amid strengthening positive momentum. Moreover, the pair’s successive higher highs together with the recent golden cross, where the 50-period simple moving average (SMA) has crossed above the 200-period SMA, reinforce...
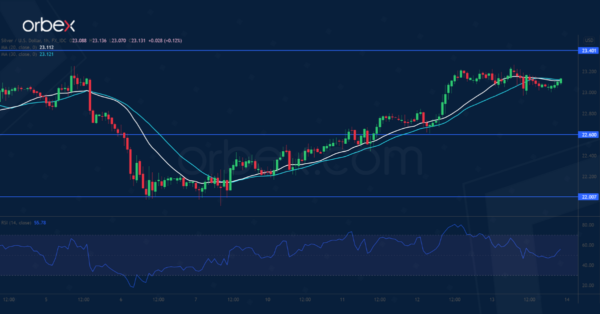
XAG/USD Tests Major Resistance
Silver extends its recovery on the back of a weak US dollar. The metal saw support at the psychological level of 22.00. A break above the resistance at 22.80 and then an acceleration to the upside indicates strong buying interest....
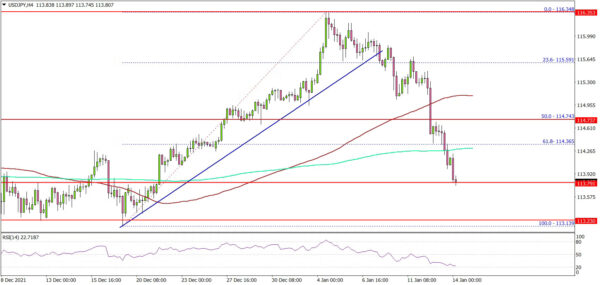
USD/JPY Starts Fresh Decrease, Key Support at 113.20
Key Highlights USD/JPY started a fresh decline from well above 116.00. It broke a major bullish trend line with support near 115.60 on the 4-hours chart. EUR/USD surged above 1.1400, and GBP/USD rallied above the 1.3700. The US Initial Jobless...
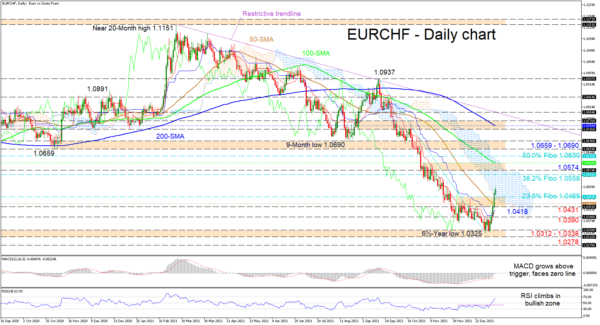
EURCHF Recoups Lost Ground as Bullish Tone Bolsters
EURCHF buyers have dominated ever since touching a 6½-year low of 1.0325, plotting four consecutive green candles, which has steered the price above the 50-day SMA of 1.0442 and the 1.0469 level, which is the 23.6% Fibonacci retracement of the...
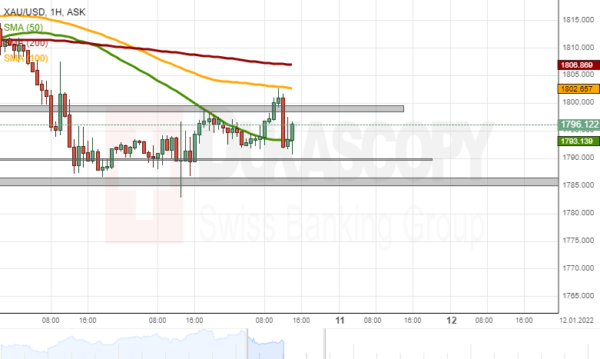
Gold Analysis: Recovers to Trade above 1,800.00
At mid-day on Monday, the price for gold broke the resistance of the 1,800.00 mark and shortly traded above this level. However, the surge was stopped and reversed by the 100-hour simple moving average at 1,802.65. If the price for...

AUDUSD Forecasting The Decline After Elliott Wave Double Three Pattern
Hello fellow traders. In this technical blog we’re going to take a quick look at the Elliott Wave charts of AUDUSD Forex Pair published in members area of the Elliottwave-Forecast . As our members know, AUDUSD s is showing lower...
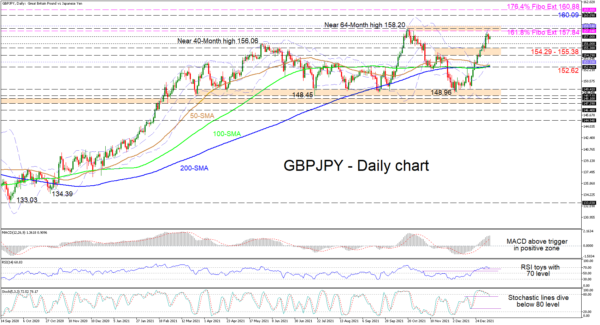
GBPJPY Bulls Hang in there Despite Minor Pullback to 157
GBPJPY’s strong two-week rally, which began from 149.50 has lost steam just shy of the 157.84 level and the more than 5-year high of 158.20, the former being the 161.8% Fibonacci extension of the down leg from 144.94 until 124.00....

US 30 Retreats from All-Time High as Bearish Forces Reign
The US 30 stock index (cash) has been experiencing a minor pullback in the last few four-hour sessions since its long-term rally peaked at the all-time high of 36,950. Moreover, the price crossed below its 50-period simple moving average (SMA), reinforcing...
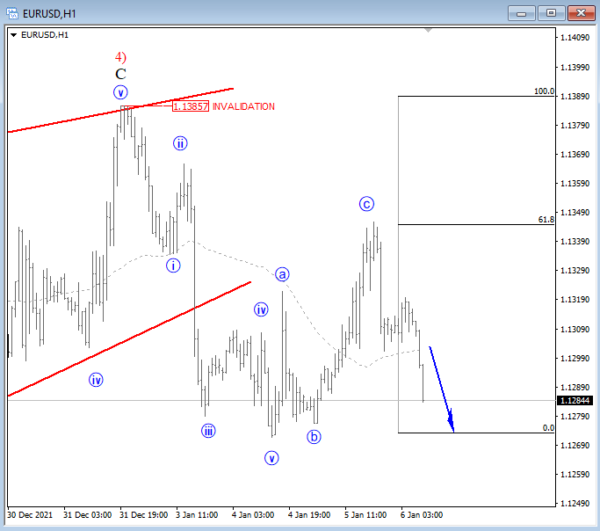
EUR/USD and GBP/USD Look Lower: Elliott Wave Analysis
Hawkish FED is causing a sharp reversal in the markets, with stocks coming down as US yields rise which makes USD very strong across the board. So we think that volatility is likely going to stay here because of Central...
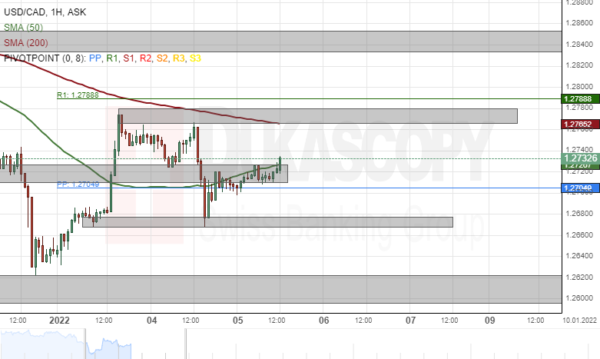
USD/CAD Analysis: Reveals New Support Zone
At mid-day on Tuesday, the USD/CAD declined and confirmed the existence of a support zone at 1.2668/1.2677. Meanwhile, the pair appeared to be almost ignoring the 50-hour simple moving average, the weekly simple pivot point and the previous low and...

 Signal2forex.com - Best Forex robots and signals


