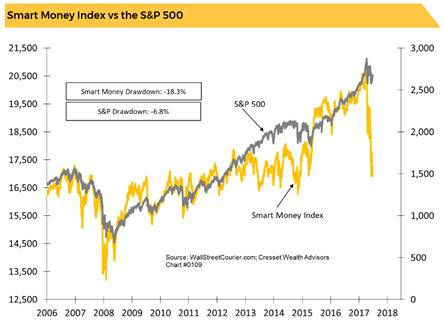
The so-called smart money has recently started to bail on the stock market at the end of the trading day, a leading indicator the bull run may be over.
Jack Ablin, chief investment officer at Cresset Wealth, explains:
The Smart Money Index (SMI) takes the first half hour of trading, which is dominated by retail investors (‘dumb money’), reverses its sign and adds it to the last half hour of trading, which is typically dominated by institutional investors (‘smart money’).
The index is down more than 18 percent since hitting an all-time high in January, according to Ablin. The S&P 500, meanwhile, is down just 5.5 percent since reaching a record on Jan. 26, suggesting it may have further to fall to catch up with this leading indicator.
“The Smart Money Index turned downward as early as June 2008, long before the September market swoon, and bottomed in October of that year, five months before the S&P rebounded,” added the strategist.
The S&P 500 briefly entered correction territory in February after hitting its record high at the start of the year. The broad index has rebounded about 7 percent from the year’s lows.
To be sure, in this age of sophisticated computer trading with large funds spreading orders out throughout the day using algorithms, this indicator’s predictive ability may not be the same as it once was.
And Ablin does not believe you should base your whole market forecast on it.
The indicator is “better characterized a spice rather than a key ingredient in the outlook mix,” he wrote.
Link to the source of information: www.cnbc.com


 Signal2forex.com - Best Forex robots and signals


