New
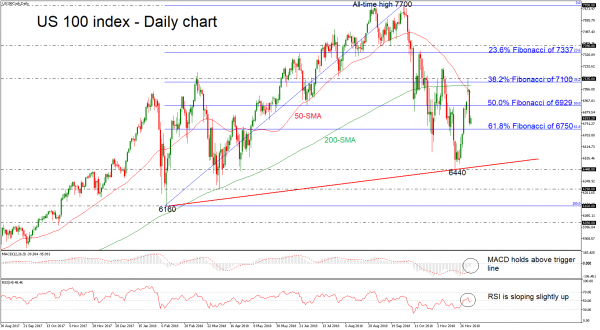
The US 100 index edged aggressively lower in Tuesday’s session as the bears continue to pull the price below the 50- and 200-simple moving averages (SMAs) and the 38.2% Fibonacci retracement level of the upleg from 6160 to 7700, around 7100. Today, the price is paring some losses and momentum indicators point slightly to the upside in the near term. The RSI lies near the neutral threshold of 50 and the MACD oscillator jumped above the trigger line but remains in negative territory.
Should the bearish structure resume, the 61.8% Fibonacci mark of 6750 would be the nearest key support for investors to look for. A drop below this line would reinforce the decline in the short-term. Further down, the 6440 around the ascending trend line would be the next hurdle that could stall steeper losses.
New in forex trading? We are professional software developers for the forex market. Check out our expert advisors. Many traders trust their accounts to automated trading. If you are beginner at financial market, trade with help of our best forex robot developed by our programmers. You can try free trader robot and to test results in your Metatrader.
However, if today’s upside movement continues, resistance could initially come from the 50.0% Fibonacci of 6929. Overcoming this barrier, would open the way for the 7135 resistance, which lies in the 38.2% Fibonacci region. A climb above these levels would help ease the downward movement and challenge the 23.6% Fibonacci of 7337.
Read how to trade Forex profitably and what are trading robots…
 Signal2forex.com - Best Forex robots and signals


