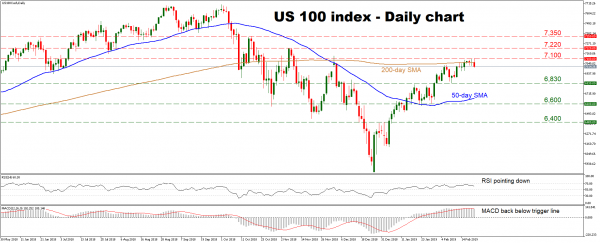
The US 100 index continues to print higher lows and higher highs on the daily chart, after it bottomed on December 26. The short-term picture thus remains somewhat positive, though the inability of the bulls to pierce above the 200-day simple moving average (SMA) is worrisome and suggests some cause for caution.
Indeed, short-term oscillators also imply a pullback may be on the cards in the immediate term, as the RSI found resistance near 70 and is pointing lower, while the MACD just crossed back below its red trigger line.
A downward correction could stall initially near 6,830, the February 8 low. A move below that could see sellers challenge the 50-day SMA, currently at 6,665. Another bearish violation would turn the bias to a more neutral one, opening the way for a test of 6,600.
On the other hand, if the bulls retake control, they may push towards the 7,100 zone, which capped the rally on February 15. Notice that the 200-day SMA – at 7,061 – can also be considered part of the same area. An upside break of that territory could see buyers aiming for the November peak of 7,220.
Summing up, the near-term picture remains cautiously positive, though a corrective pullback may be on the cards in the immediate term.
For traders: our Portfolio of forex robots for automated trading has low risk and stable profit. You can try to test results of our forex ea download
Signal2forex reviews
 Signal2forex.com - Best Forex robots and signals


