Week beginning 4 March 2019
- Some risks next week, and observations on the US.
- RBA: policy decision, Governor Lowe speaks.
- Australia: GDP partials, GDP, dwelling approvals, retail sales, trade balance.
- NZ: building work put in place.
- China: National People’s Congress, trade balance.
- Europe: ECB policy decision, GDP 3rd estimate.
- US: non-farm payrolls, Fed Chair Powell speaks.
- Key economic & financial forecasts.
Information contained in this report current as at 1 March 2019.
Some Risks Next Week, and Observations on the US
The Reserve Bank Board meets next week on March 5.
On February 21 Westpac announced a change in view for the outlook for the cash rate.
After correctly forecasting unchanged policy since August 2016 (despite the RBA; the market and most economists predicting rate hikes) we finally changed our call to a 25 basis point cut in August and another 25 basis point cut in November.
We would be very surprised if the Board decided to move next week but, given our change of view, must accept that as we move closer to our August target, meetings will become increasingly “more live”.
The reasons behind our change in view have been extensively explained in the note on February 21.
The GDP report for the December quarter 2018 which prints on March 6 will be important for the rate outlook. Following the 3.1% reported fall in construction (around 14% of GDP) we have further revised down our forecast for Q4 GDP growth to 0.2%. That would follow a currently reported 0.3% for Q3, implying that the economy lost considerable momentum through the second half of 2018. This forecast is based on consumer spending growth of the reported 0.3% in Q3 and our estimated 0.5% in Q4. Risks to our consumption view are substantial statistical revisions to Q3 and a stronger than expected lift in Q4, despite weak retail sales and falling vehicle sales.
Insights on the US and FOMC policy
On February 18, I returned from a two week marketing trip in the US where I met with a number of FOMC members; real money managers; hedge funds; and corporates.
One consequence of this visit has been the decision to revise our forecast for the federal funds rate in 2019 from hikes in June and September to one hike which will be delayed until December.
We had been aware that on November 28 (Economic Club of New York) Chairman Powell noted: “Interest rates are still low by historical standards, and they remain just below the broad range of estimates of the level that would be neutral for the economy — that is, neither speeding up nor slowing down growth”.
Subsequently on December 15, he further increased the federal funds rate by 25 basis points.
With that move and the expectation that the economy was likely to slow from a 3% growth pace in 2018 to a 2–2.5% pace in 2019, the appetite for rate increases from the Federal Reserve has dissipated in the markets.
While it is accepted that the consumer will continue to support growth, other, more cyclical parts of the economy, are seen to be slowing. These include business investment; housing and exports.
Even the economists who confidently expected multiple rate hikes from the Federal Reserve as recently as early December have now retreated to expecting “maybe” one more hike near the end of the year.
It is accepted that it will take considerable time for the FOMC to make a case for higher rates. The earliest likely opportunity would be around the Jackson Hole Conference in August. The Chairman is also likely to need to link any further hikes to a clear rhetoric around the economy (i.e. the FOMC did not raise rates, it was the US economy).
Proponents of the “neutral” setting approach accept that the measure of neutral is too imprecise to be able to assess that rates are at or above neutral.
It was much easier in 2018 – rates were clearly below neutral; and the economy had tailwinds – fiscal policy; global growth and easy financial conditions.
In 2019, rates are 100 basis points higher; the stimulatory effect of fiscal policy is dissipating and should a range of spending programs expire by 2019 H2 (as currently legislated), fiscal policy will become a headwind. In addition, global growth is slowing and financial conditions are tightening.
While equities usually have a relatively low weight in Financial Conditions Indexes (around 5–10%) they are more significant in assessing the outlook for the economy – as a proxy for risk and for businesses’ outlook on growth. While the share market has regained much of the losses of early December, this volatility signals a degree of caution is warranted.
“Neutral” or R* is broadly defined as the interest rate setting that is consistent with 2% inflation (as measured by core PCE) and potential growth. Although, in 2018, inflation had hovered below the 2% target, GDP growth of 3% was substantially above the measure of potential which is 1.75–2.0%.
For 2019, growth is expected to slow to 2–2.5%, slightly above potential, but inflation is expected to remain “sticky” at around 2%, indicating that policy is very close to “neutral”. We must also respect the argument that inflationary expectations need to be anchored around 2%. Allowing inflation to lift above 2% to emphasise symmetrical policy is generally supported.
There is universal confidence, almost complacency, that prospects for a “blow–out” in inflation are limited. Risks on inflation continue to be pitched to the downside.
From my perspective, the risk with this benign outlook for policy is around the labour market and wages. Responding to tightening conditions in the labour market (although overstated by the headline unemployment rate due to ongoing slack associated with the low participation rate) we have seen upward pressures on wages growth. In 2016 and 2017, average weekly earnings grew around an annual pace of 2.5–3.0%. That has now lifted to around 3.5% in 6 month annualised terms. Momentum in the jobs market does not seem to be easing and a reasonable view is that wages growth will continue to climb.
The consensus outlook for wages growth is mixed but generally relaxed – labour’s bargaining power has declined structurally; businesses have limited pricing power to pass on wage increases; business is committed to labour saving investments; and wage and price expectations are low.
Discussions with researchers highlight the lack of a relationship between wages growth and core PCE inflation (one economist told me he worked in the wages and prices section of the Washington Fed for five years and was unable to prove a significant causal relationship). Furthermore, there is limited “cyclicality” in core PCE with “administered” prices and “shelter” playing important roles.
Theory, of course, dictates that wage growth is determined by inflation (or inflationary expectations) and productivity growth. The productivity outlook for the US is not encouraging so theory would dictate that a lift in wages should be associated with rising inflation. No response from inflation can only mean that inflation is being incorrectly measured or there is some other explanatory variable like “labour slack” that fills in the gap. Certainly there is a legitimate concern that wages might experience some non–linear surge as “catch–up” to the slow adjustment in the early stages of the recovery – previously, wages did not fall despite the collapse in demand post GFC. For now, I am comfortable with the benign consensus view but am still troubled by a rising wages/sticky inflation scenario.
We doubt the recession thesis for the US. Recessions in the US are typically caused by a large financial shock (dot–com bubble and GFC) or the FOMC losing control of inflation and over tightening. To date, there is limited evidence of extreme financial excess, while “stable” core PCE inflation represents no marked threat of overshooting. With only one more hike pencilled in for 2019 and no recession on the horizon, we expect the federal funds rate to be steady through 2020.
The week that was
This week, investment partial data for the December quarter cast a long shadow over Australian GDP – next week’s key release.
Each quarter in Australia, we receive two updates related to investment ahead of the GDP report: construction work done; and the CAPEX survey. The former outlines activity across the construction sub-sectors, while the latter is a guide for equipment investment.
In Q4, construction work done was a material disappointment, aggregate activity falling 3.1% against the market’s expectation of +0.5%. The main contributors to this downside surprise were public construction (which was expected to rise) and residential construction (which surprised by declining at a faster-thanexpected pace). Ahead, public work is set to bounce, with the pipeline of work lasting years into the future. Residential construction however is a very different story, with further sizeable falls to come in 2019 and 2020. With the construction sector making up 14% of our economy, the 3.1% decline in total activity in Q4 should take 0.4ppts from GDP growth. Note though that outcomes for this survey do not always translate one-for-one to GDP.
The CAPEX survey was, in contrast, essentially in line with our expectation, with spending on equipment up a modest 0.7% in Q4. Given this result, our focus quickly shifted to assessing the investment intentions of survey recipients, provided for both the 2018/19 and 2019/20 financial years. Based on average realisation ratios, we calculate that the current estimates for financial years 2018/19 and 2019/20 imply an increase in business investment of just 3% and 1% respectively. By industry, the end of the mining investment downswing is apparent, with investment intentions for the sector swinging from –8% in 2018/19 to +5% in 2019/20. Meanwhile the forward view for manufacturing and services points to a reduced appetite for investment come 2019/20. Note that this is only the first estimate for 2019/20, and often these prove unreliable. Historically it has been the case that firms typically upgrade their investment intentions as the year progresses. Still, given our expectation of a weak consumer and the deterioration in residential construction, not to mention global uncertainties, business investment growth in the coming two years is likely to remain subdued.
Q4 GDP will be released for Australia next Wednesday. Given the weak read for construction and no offset from equipment spending, we have revised down our forecast to just 0.2%, 2.4%yr. If it prints around this level, and absent a material revision to Q3, then growth will have more than halved from the first half of 2018 to the second. Within the detail of the GDP report, the state of consumer incomes and spending will be a particular focus. The consumer is key to our call for two 25bp rate cuts in 2019, in August and November.
Moving offshore, US GDP beat market expectations in Q4, but was in line with our own at 2.6% annualised. This is a robust outcome which leaves year-average growth at 2.9%, well above potential. Looking forward, the detail of the Q4 release highlights an important shift in the make-up of growth. Simply, the consumer is increasingly dictating headline momentum, as business investment moderates and residential construction falls. The importance of the consumer will only grow hence, given these business and residential investment trends are set to persist, and support from government spending will also likely end in late-2019. The most probable outlook for the US is still growth a little above trend in 2019 and 2020, circa 2.0%. As per comments from Chair Powell and other FOMC members this week, this warrants a view that a further rate hike may prove necessary, but that it will only be delivered after inflation and activity data justify it. We hold that the US real economy will warrant one more hike at end-2019, though global and domestic risks have to recede fully by then for this outturn to transpire.
Finally, ahead of next week’s Annual National People’s Congress in China, the NBS manufacturing PMI confirmed the sector remains under considerable pressure from weak external demand. The PMI printed below 50 for a thirdconsecutive month, at a three-year low. Though growth in fixed asset investment remains historically soft, total orders of manufacturers lifted back above the 50 expansion/ contraction mark in February, even as external orders weakened further to their lowest level since the GFC. Along with the relative strength of the services PMI, February’s orders outcomes point to underlying domestic momentum building in China’s business sector. As we recently outlined in our 2019 outlook, the worst is behind China with respect to investment growth. A modest but enduring uptrend should now take hold, as policy easing takes effect and authorities pursue quality, long-term growth in their capital stock and for the economy at large.
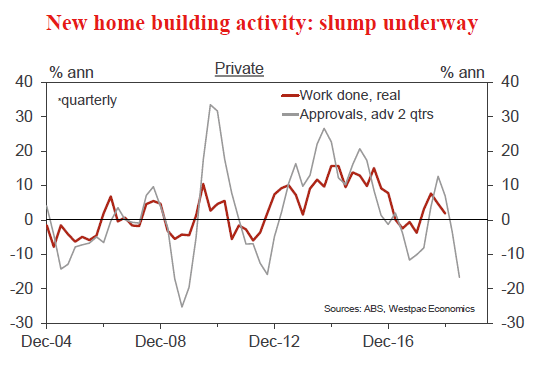
Chart of the week: Australian housing construction
The deterioration in the construction sector was a key development in 2018, contributing to the material loss of momentum in the economy from the middle of the year.
Consistent with this, the private business surveys have reported a significant slowing in business conditions.
The housing sector is now in a downturn, with further sizeable falls ahead. This follows a strong and extended upswing over recent years.
Private new home building activity grew strongly in Q1 and Q2, +4.3% and +4.0%, respectively. That was followed by sizeable declines in Q3 and Q4, -2.5% and -3.6%.
Private dwelling approvals collapsed late in 2018, tumbling by 17.5% over the two months to December. Approvals are now around 30% below the levels prevailing over the second half of 2017.
New Zealand: week ahead & data wrap
Ups and downs
The recent data for New Zealand has taken on a distinctly mixed complexion. But at the least it has provided some support for our view that last year’s spike in petrol prices was a temporary hindrance to activity.
Developments in household spending have been something of a puzzle in recent times. Employment has been rising at a solid pace, and wage growth has picked up to some degree. On top of this, the Government’s Families Package came into full force in July, putting more money into the pockets of lower income households. Yet retail sales volumes in the September quarter were close to flat.
We took the view that the impact of the Families Package was being cancelled out by a spike in petrol prices, which reached new record highs in September and early October. That increase siphoned at least $130 million out of households’ wallets between July and October, leaving them with less to spend on other items.
The spike in petrol prices has since been completely unwound, giving household budgets some relief. Combined with the ongoing payments from the Families Package, we expected retail spending to regain some momentum again.
That turned out to be the case. Retail sales in the December quarter rose by 1.7%, bouncing back by even more than we expected. There were gains across most categories, including large gains in areas such as supermarkets and dining out.
It remains true that the pace of growth in retail spending has come off its highs in the last couple of years. Slowing population growth has been one factor. And the household wealth effect is alive and well – spending growth has slowed as house price inflation has cooled off. Both of these factors are likely to weigh further on spending growth in the coming years.
Elsewhere, the theme of mixed data continued this week. On the positive side, building consents were surprisingly strong in January, with a 16% jump in seasonally adjusted terms. (In raw terms, the consent numbers were up slightly in what is normally a slow month.) The monthly gain was very much centred on Auckland, and was driven by both apartments and standalone houses.
Over 13,200 new homes were consented in Auckland in the last year, the highest level in several decades (the official figures go back to 1990). The number of homes being consented is now roughly in line with changes in the population. And with population growth itself set to slow down in the coming years, we think the construction cycle is nearing a peak.
Another positive development – of sorts – was an upgrade to Fonterra’s farmgate milk price forecast for this season to $6.30-6.60 per kg (previously $6.00-6.30). However, the higher payout reflects an expected shortfall in milk collections over the remainder of the season, as a result of the unusually hot and dry weather over the past month. Prices in the twicemonthly GlobalDairyTrade auctions have risen by 15% since the start of year, which to some degree will already reflect an awareness of the recent climatic conditions. Nevertheless, it will be interesting to see how next week’s auction fares after the Fonterra announcement.
The less welcome news this week came from the ANZ business confidence survey, where the modest recovery in confidence we saw over the last quarter of 2018 was unwound in February (the survey is not held in January). There was a deterioration across most activity indicators including expectations of profitability, employment, investment and export intentions. The results were mixed across sectors, with a particularly sharp fall in expectations for firms in the construction sector.
Business confidence has been markedly weaker since the change of government in 2017, much more so than other indicators that point to modest growth in economic activity. There has no doubt been an element of ‘protest vote’ to the survey responses, though there were signs that this aspect was easing off by the end of 2018. It will be interesting to see how confidence fares in the March survey, after the release of the Tax Working Group’s final report which, among other things, recommended the introduction of a capital gains tax on investment properties, farms, and businesses.
Next week brings the last of the sectoral surveys that will be used to calculate December quarter GDP, including manufacturing, wholesaling and building activity.
Notwithstanding the strong retail trade figures, the sectoral details that we have to date have been on the soft side; we’re currently forecasting just a 0.3% rise in GDP. But there’s a good chance that some of this weakness has just been survey noise, or issues of timing. Our view remains that GDP growth will pick up again over 2019, supported by rising government spending and a lift in construction activity.
Data Previews
Aus Q4 company profits
- Mar 4, Last: 1.9%, WBC f/c: 1.0%
- Mkt f/c: 3.0%, Range: 0.5% to 4.7%
Profits are advancing, boosted by higher commodity prices.
In Q3, profits rose by 1.9%, including a 3.4% increase for mining and around a 1% gain across the broader economy.
For Q4, we anticipate a 1.0% rise in profits (as reported by the Business Indicators survey).
Mining profits will likely post another strong gain, up almost 5% in line with higher commodity prices. Since the low at end 2015, mining profits have jumped by almost 130%.
For the non-mining sectors, the loss of economic momentum may have seen profits move sideways. That would still leave profits up by more than 20% from end 2015.
As to the national accounts estimate of profits (which abstracts from variations in the value of inventories) we expect a gain in Q4 of around 1.8%.
Aus Q4 inventories
- Mar 4, Last: 0.0%, WBC f/c: 0.3% (+0.1ppt)
- Mkt f/c: 0.3%, Range: 0.0% to 0.8%
Over the past year, inventories increased by a moderate 1.8% in response to rising domestic demand.
In the June quarter, inventories expanded by 0.6%, with a lift in mining (which more than outweighed a temporary dip in manufacturing) and with a 0.7% rise across other sectors.
For the September quarter, inventories are expected to expand further, albeit at a marginally slower pace, up a forecast 0.5%. Housing and consumer spending took on a softer tone in the quarter, weighing on the need to add to inventories.
This would see inventories make a very small subtraction from growth in Q3, in the order of -0.1ppt.
Aus Jan dwelling approvals
- Mar 4, Last: –8.4%, WBC f/c: –1.0%
- Mkt f/c: 1.5%, Range: -5.0% to 8.0%
Dwelling approvals slid sharply into year end – declining 8.4% in the final month to be down 26% over the fourth quarter. The composition also showed a notable shift with a continued decline in high rise approvals but weakness starting to show through in other segments as well. The shorter ‘lags’ on non high rise work means these declines will likely impact activity through the first three quarters of 2019.
High rise approvals are likely to settle around current low levels. While there is a risk of a technical bounce following two big negatives, we expect the Jan update to reflect the ‘one-way traffic’ in housing markets evident through late 2018. On balance we expect Jan to show a 1% decline. As always, risks are compounded by the very low activity over the holiday season which means moves can be significantly amplified by seasonal adjustment.
Aus Q4 net exports, ppt’s cont’n
- Mar 5, Last: +04, WBC f/c: -0.1
- Mkt f/c: -0.1, Range: -0.4 to 0.2
Net exports were a positive in Q3, adding 0.4ppts to growth. This was despite flat exports and was driven by a 1.5% dip in import volumes.
For Q4, net exports are likely to be a negative – a small one, subtracting 0.1ppt from activity.
Export volumes appear to have stalled for a second quarter. The drought is a material headwind. Falls in rural goods exports (led by cereals) is offsetting gains in services and manufactures, while resources remain patchy constrained by supply disruptions.
Import volumes appear to have advanced modestly, up around 0.6% we estimate.
Aus Q4 current account, AUDbn
- Mar 5, Last: -10.7, WBC f/c: -9.4
- Mkt f/c: -9.2, Range: -11.5 to -8.5
Australia’s current account deficit is relatively well contained currently, at 2.2% of GDP in the September quarter, well below the post 1990s average of 4.2%.
In Q3, the deficit was $10.7bn, with a trade surplus of $6.6bn (since revised lower to $5.8bn) and an income deficit of $16.9bn (well up from $13.7bn a year earlier).
For Q3, the current account deficit is expected to narrow a little to a forecast $9.4bn.
The trade surplus widened to $8.5bn. Key to this improvement, export earnings were boosted by higher commodity prices. The terms of trade rose by around 2.5% we estimate.
The net income deficit is expected to widen further, to $17.9bn, as the higher commodity prices boost returns to foreign investors in the mining sector.
Aus Q4 public demand
- Mar 5, Last: 1.5%, WBC f/c: 0.4%
The public sector – directly accounting for almost a quarter of the economy – has been a key growth driver over recent years, increasing by 4.9% in 2015, 6.0% in 2016, 4.5% in 2017 and by 4.5% in the year to 2018 Q3.
Public investment is trending sharply higher, off low levels, with a focus on long overdue transport projects. Health spending (included in ‘consumption’) is also moving higher at a brisk pace.
However, in Q4, public demand is expected to advance at a much more modest pace, up by 0.4%.
Notably, public construction surprised, reporting a 6.0% decline – possibly reflecting bottlenecks and unseasonable weather (Sydney had a particularly wet spring). The pipeline of work remains sizeable and a near-term rebound is likely.
Aus RBA policy announcement
- Mar 5, Last: 1.50%, WBC f/c: 1.50%
- Mkt f/c: 1.50%, Range: 1.50% to 1.50%
The Reserve Bank Board meets on March 5. On February 21 Westpac announced a change in view for the outlook for the cash rate to a 25bps cut in August and another 25bps cut in November. We would be very surprised if the Board decided to move next week but, given our change of view, must accept that as we move closer to our August target, meetings will become increasingly “more live”.
At 9 am on Wednesday, Governor Lowe is speaking on “The Housing Market and the Economy”. In his most recent speech on February 22nd, he noted possible spill-overs from declining house prices to weaker consumption and dwelling construction. Nonetheless, he reiterated the RBA’s view that the “adjustment in the housing market is not expected to derail the economy”. Westpac believes these spill-overs will be more material, and indeed through the latter half of 2018, data has already shown dwelling construction turn lower, weak retail sales, and falling vehicle sales.
Aus Q4 GDP
- Mar 6, Last: 0.3%qtr, 2.8%yr, WBC f/c: 0.2%qtr, 2.4%yr
- Mkt f/c: 0.5%, Range: 0.1% to 0.6%
The Australian economy lost considerable momentum between the first and second half of 2018, from a 4% annualised pace to our forecast of only a 1% pace.
The slowing was centred on housing and the consumer as lending conditions tightened and wages remained sluggish.
For Q4, we expect real GDP growth of 0.2%qtr, 2.4%yr. The arithmetic is: domestic demand, 0.2%, inventories +0.1ppt and net exports, -0.1ppt.
Partials suggest / reveal that: retail sales stalled (+0.1%, including a -1.1% for NSW); construction activity declined sharply, -3.1% (a sizeable fall in housing, sharp drop in public works and softness in business); and exports likely stalled (dented by rural goods reflecting the ongoing drought).
Hours worked rose, but not strongly, +0.4%, and productivity may have declined due to weather disruptions.
Aus Jan retail trade
- Mar 7, Last: –0.4%, WBC f/c: –0.1%
- Mkt f/c: 0.3%, Range: -0.1% to 0.7%
Retailers recorded a weak finish to 2018, monthly sales dipping 0.4% in December. While some of this likely reflects ‘residual seasonality’ with the ABS struggling to adjust for the shifting in timing of sales around the Christmas period (the rising popularity of ‘Black Friday’ and new year sales in particular) the underlying trend is still clearly weak. At 2.8%yr, annual growth is sluggish at best with the six month annualised pace below 2%.
Consumer sentiment had a shaky start to 2019, dipping into net pessimistic territory for the first time since 2017 but recovering in Feb. Private sector business surveys suggest there has been no respite for retailers with a sharp deterioration in conditions in Dec extending into Jan. We expect total retail sales to show a 0.1% dip for the Dec month.
Aus Jan trade balance, AUDbn
- Mar 7, Last: 3.7, WBC f/c: 3.1
- Mkt f/c: 3.0, Range: 2.2 to 4.5
Australia’s trade account is expected to begin the 2019 year in surplus, for a 13th consecutive month.
In December, the surplus jumped by $1.4bn to $3.7bn largely on a sharp drop in imports.
For January, we expect a partial reversal, to a surplus of $3.1bn, on a likely rebound in imports.
The import bill is expected to bounce back in January, up by around $1.4bn (+4%), largely reversing the $2.1bn drop evident in December.
Export earnings over the past year have been boosted by higher commodity prices – a dynamic that has extended in to 2019. Exports are expected to rise by around 2.2% in January, +$0.8bn, on: higher iron ore prices; a rebound in gold (off a low level); but with a possible partial offset from weakness in rural goods.
NZ Q4 building work put in place
- Mar 8, Last 0.7%, Westpac f/c: 1.0%
- Mkt f/c: 1.0%, Range: -0.8% to 1.5%
Construction activity rose by 0.7% in the September quarter, and was up 2.1% over the year. The September quarter rise was underpinned by a 1.2% increase in residential building centred on Auckland, while non-residential construction was flat over the quarter.
We’re expecting another quarter of modest growth in December, with total building activity expected to increase by 1%. That’s being supported by modest gains in both residential and non-residential building.
Building activity is set to take another step up over 2019 as home building in Auckland picks up. However, the construction cycle is close to peaking, especially with postearthquake reconstruction winding down.
US Feb employment report
- Mar 8, nonfarm payrolls, last 304k, WBC 175k
- Mar 8, unemployment rate, last 4.0%, WBC 3.9%
After a strong 2018, employment growth started 2019 with extraordinary vigour, nonfarm payrolls rising 304k in the month. Admittedly, employment in the prior two months was revised down by 70k. Still, the net addition of 234k is unquestionably strong.
Come February, we look for a moderation back to around 175k for monthly employment growth. If seen in both February and March, this pace would result in a Q1 monthlyaverage pace in line with 2018’s.
Looking ahead, employment gains in 2019 are expected to be softer than in 2018, but still ahead of labour force growth. The consequence will be a steady drift lower in the unemployment rate towards 3.5%.
Euro Area ECB policy decision
- Mar 7, deposit rate: -0.4%
March will focus on projections, guidance, and liquidity.
Regarding macroeconomic projections, the ECB have downplayed the current slowdown’s impact on the mediumterm outlook, highlighting temporary factors. The incoming ECB Chief Economist Lane noted recent data suggests “reasonably small adjustments to the [ECB] forecasts”. But, a high level of geopolitical uncertainty underscores caution.
In terms of the implications for policy rate forward guidance, the Bank of France Governor noted that if the downturn continues into summer, then the ECB will be “ready to adapt their monetary policy guidance”. For now, there is sufficient ‘state-contingency’ contained in the current guidance with rates on hold “at least through the summer of 2019”.
The liquidity discussion is on the maturing first €400bn operation of TLTRO-II in June 2020. This will affect banks in June 2019 due to regulatory funding ratios. The question is on how the ECB may extend loans to avoid “cliff effects”.
Signal2forex review
 Signal2forex.com - Best Forex robots and signals


