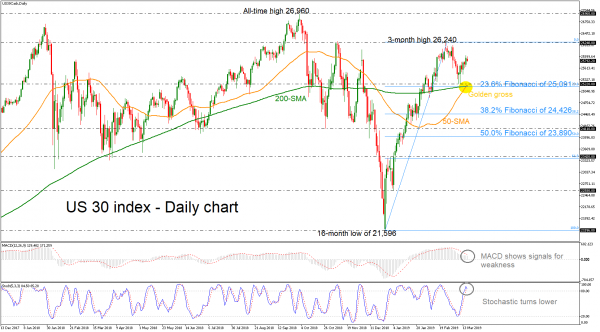
The US 30 index recorded a bullish signal in the previous week, completing a golden cross within the 50- and the 200-simple moving averages (SMAs) in the daily timeframe. Today, though, the index is on the backfoot and the technical indicators suggest that the market could ease a little bit in the short-term. The stochastic oscillator is ready for a bearish cross in the overbought zone, while the MACD remains below trigger line.
In case of a correction lower, preliminary support may be found near the 25,220 level, which stands near the crossroads of the 50- and 200-day SMAs as well as around the 23.6% Fibonacci retracement level of the upleg from 26,596 to 26,240 around 25,091. A clear break below this area would turn the bias back to neutral in the short-term and could set the stage for a rest around the 38.2% Fibonacci of 24,426.
On the other hand, if the bulls continue to have the control, immediate resistance could come around the three-month high of 26,240, where it topped on February 25. If buyers pierce above that, the next obstacle may be the all-time high of 26,960.
In the short-term, the indicators point to a possible bearish retracement, however, the index is still creating higher highs and higher lows over the last couple of months, which augurs well for the medium-term.
Signal2forex reviews
 Signal2forex.com - Best Forex robots and signals


