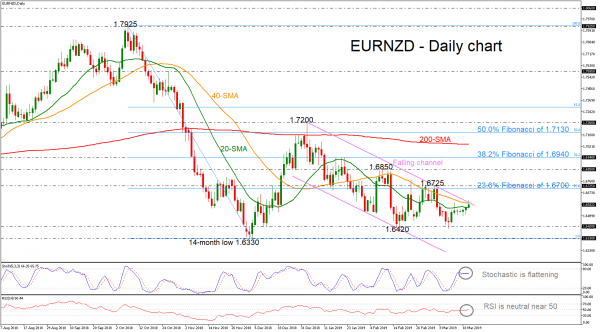
EURNZD has been hovering within a downward channel after the pullback on the 1.7200 psychological level on January 3. Today, the price pierced the 40-simple moving average (SMA) and the falling trend line earlier but it could hold above them, with the technical indicators suggesting now weak momentum as the stochastic and the RSI are flattening.
A step higher may reach key resistance at the 23.6% Fibonacci retracement level of the downward movement from 1.7925 to 1.6330, near 1.6700, ahead of the 1.6725 barrier. More gains could send prices until the 1.6850, taken from the highs on February 8.
Alternatively, in case of a decline, immediate support could come from 1.6420 before the focus shifts to the 14-month low of 1.6330. Any violation of this line would bring more pressure to the market, with the price probably stretching further down to test the 1.6140 barrier, reached on October 2017.
In the medium-term picture the pair is forming a bearish structure below 1.7200, and more importantly under the flat 200-day SMA, which is flattening.


 Signal2forex.com - Best Forex robots and signals


