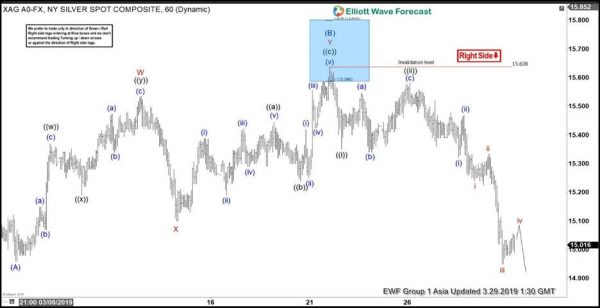
Silver broke below March 7 low ($14.96) and shows a sequence of lower low from Feb 21 high ($16.2), suggesting further downside is likely in the shorter cycle. The decline from Feb 21 looks is unfolding as a zigzag Elliott Wave structure. Down from $16.2, wave (A) ended at $14.96 and wave (B) bounce ended at $15.64. Internal of wave (B) subdivided as a double three Elliott Wave structure where wave W ended at $15.53, wave X ended at $15.1, and wave Y ended at $15.63.
As Silver has broken below wave (A) at $14.96, this confirms wave (C) has started. An ABC zigzag Elliott Wave structure has a subdivision of 5-3-5. Thus, wave (C) lower needs to have at minimum 5 waves subdivision. So far, we can only see 3 waves down from wave (B). Down from $15.63, wave ((i)) ended at $15.35, wave ((ii)) ended at $15.58, and wave ((iii)) remains in progress. We think that Silver likely see at least 1 more leg lower to end a 5 waves down from $15.6. This view is valid as far as pivot at $15.6 remains intact.
Potential wave (C) target can be measured as equal to wave (A), which comes to as low as $14.08 – $14.37. This will effectively retest the 2018 low at $13.87. Wave (C) may truncate and not reach the ideal equality at $14.08 – $14.37, but at least we should be able to see 5 waves subdivision within wave (C). Near term, while bounces stay below $15.63, expect Silver to extend lower at least 1 more leg.
1 Hour Silver Elliott Wave Chart
Signal2forex reviews
 Signal2forex.com - Best Forex robots and signals


