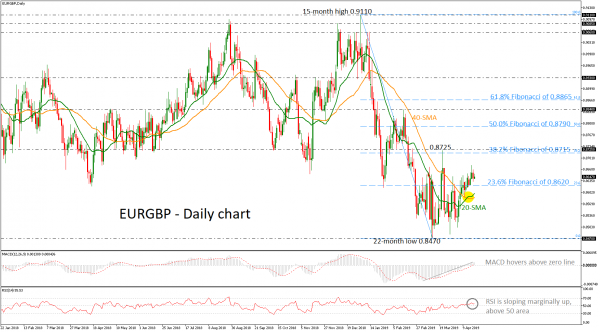
EURGBP is in a neutral mode after tumbling below the 38.2% Fibonacci retracement level of the downleg from the 15-month high of 0.9110 to the 22-month low of 0.8470 on February 19; prices are consolidating within the 0.8715 resistance and the 0.8470 support.
The technical indicators, however, are pointing to positive momentum in the near term. The MACD is strengthening its movement above its trigger and zero lines, while the RSI holds in positive area and is turning slightly higher. It is worth mentioning that the 20- and 40-simple moving averages (SMAs) created a bullish cross in the daily chart, confirming the recent upside move in the very short-term.
In case of upside movement, gains could follow until the 38.2% Fibonacci mark of 0.8715 which stands near the 0.8725 resistance barrier. Even higher, a climb could increase bullish sentiment until the 50.0% Fibonacci of 0.8790.
Alternatively, downside pressure below the 23.6% Fibonacci region of 0.8620 could drive the price south and towards the 22-month low of 0.8470. A failure to hold inside the narrow range would shift the focus to the 0.8380 low reached on May 2017.
A drop below 0.8470, would turn the short and the medium-term outlook into bearish, while a climb above 0.8715 would bring the bullish view into play only in the short term.
Signal2forex reviews
 Signal2forex.com - Best Forex robots and signals


