

Types of Doji Candles — 5 Patterns Every Trader Should Know (2026)
The Doji candlestick is one of the most powerful and frequently occurring patterns in technical analysis. It represents market indecision and can signal both reversals and continuations depending on the context. In this guide, we’ll explore all 5 types of Doji candles — Standard, Long-Legged, Dragonfly, Gravestone, and 4-Price Doji — and show you how to trade them effectively.
1. What Is a Doji Candle?
A Doji candle is a candlestick pattern where the opening and closing prices are virtually equal — or very close to each other. This creates a candle with a very small or non-existent real body, typically appearing as a cross, a plus sign, or a horizontal line.
📌 Key Definition: A Doji represents market indecision. Neither buyers (bulls) nor sellers (bears) were able to gain control during the trading session. The market is at a stalemate, and a decisive move may follow.
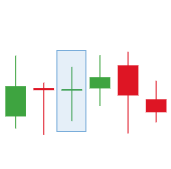
Fig 1: The 5 types of Doji candles — Standard, Long-Legged, Dragonfly, Gravestone, and 4-Price Doji.
How Doji Candles Are Formed
A Doji forms when the open and close are at the same price level, or very close to it. This means that whatever movement occurred during the session, it ended with no net change.
- Price opened at a certain level
- Price moved up and/or down during the session
- Price closed at or very near the opening price
- Result: A candle with a very small body and long shadows (or no shadows at all)
What Doji Candles Tell Traders
- Indecision — neither buyers nor sellers have control
- Potential reversal — especially at the top or bottom of a trend
- Potential continuation — in the middle of a trend, it may signal a pause
- Requires confirmation — a Doji alone is not a trading signal
⚠️ Important: A Doji by itself is not a trading signal. It must be confirmed by the next candle. The context in which the Doji appears — at support, resistance, or within a trend — determines its significance.

Fig 2: The structure of a Doji candle — small body with long shadows indicating market indecision.
2. Standard Doji
The Standard Doji is the most basic and frequently occurring Doji pattern. It forms when the opening and closing prices are virtually identical, with wicks (shadows) on both sides that are relatively balanced.
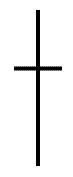
Fig 3: Standard Doji — open and close are virtually equal with balanced upper and lower shadows.
Key Characteristics
- Real body: Very small or non-existent
- Upper shadow: Present, relatively balanced
- Lower shadow: Present, relatively balanced
- Signal: Market indecision
What the Standard Doji Tells You
- The market is undecided — neither buyers nor sellers dominated the session
- It often appears during consolidation or before a breakout
- The meaning depends on context — at the top of a trend, it may signal a reversal; in the middle, it may signal a continuation
- Always wait for confirmation from the next candle
📌 Trading Tip: A Standard Doji at a key support or resistance level is more significant than one in the middle of a range. Look for confirmation with the next candle.
3. Long-Legged Doji
The Long-Legged Doji is a variation where the upper and lower shadows (wicks) are significantly long, while the real body remains very small. This pattern indicates strong indecision and a fierce battle between buyers and sellers.

Fig 4: Long-Legged Doji — long upper and lower shadows indicate a strong battle between bulls and bears.
Key Characteristics
- Real body: Very small
- Upper shadow: Very long
- Lower shadow: Very long
- Signal: Strong indecision, potential reversal
What the Long-Legged Doji Tells You
- Fierce battle — both buyers and sellers pushed price to extremes
- Neither side could maintain control — the market is highly uncertain
- Often appears after a strong trend move
- Can signal a potential reversal or a pause
- Requires strong confirmation due to the extended range
📌 Trading Tip: The longer the shadows, the stronger the indecision. A Long-Legged Doji after a large price move is more likely to signal a reversal than one in a quiet market.
4. Dragonfly Doji
The Dragonfly Doji is a distinctive pattern where the opening and closing prices are at the high of the session, with a long lower shadow and little to no upper shadow. It resembles a “T” shape.
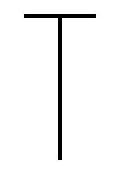
Fig 5: Dragonfly Doji — a T-shaped pattern with a long lower shadow, indicating buyers rejected lower prices.

Fig 6: Dragonfly Doji at the bottom of a downtrend — a strong bullish reversal signal.
Key Characteristics
- Real body: Very small
- Upper shadow: None or very short
- Lower shadow: Long
- Signal: Bullish reversal (especially at support)
What the Dragonfly Doji Tells You
- Sellers pushed price lower during the session
- Buyers stepped in and drove price back up to the opening level
- The long lower shadow shows that bears tried to take control but failed
- Indicates buying pressure and potential upside
- Strongest signal when it appears at the bottom of a downtrend
💡 Pro Tip: The Dragonfly Doji is one of the most bullish candlestick patterns. When it appears at support, it suggests that sellers are exhausted and a reversal may be imminent.
5. Gravestone Doji
The Gravestone Doji is the opposite of the Dragonfly Doji. It forms when the opening and closing prices are at the low of the session, with a long upper shadow and little to no lower shadow. It resembles an inverted “T” shape.
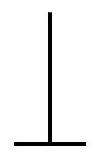
Fig 7: Gravestone Doji — an inverted T-shaped pattern with a long upper shadow, indicating sellers rejected higher prices.

Fig 8: Gravestone Doji at the top of an uptrend — a strong bearish reversal signal.
Key Characteristics
- Real body: Very small
- Upper shadow: Long
- Lower shadow: None or very short
- Signal: Bearish reversal (especially at resistance)
What the Gravestone Doji Tells You
- Buyers pushed price higher during the session
- Sellers stepped in and drove price back down to the opening level
- The long upper shadow shows that bulls tried to take control but failed
- Indicates selling pressure and potential downside
- Strongest signal when it appears at the top of an uptrend
⚠️ Important: The Gravestone Doji is one of the most bearish candlestick patterns. When it appears at resistance, it suggests that buyers are exhausted and a reversal may be imminent.
6. Four-Price Doji
The Four-Price Doji is the rarest and most extreme Doji pattern. It occurs when the open, high, low, and close are all at the same price level — appearing as a horizontal line on the chart.
Fig 9: Four-Price Doji — the rarest Doji pattern where open, high, low, and close are all at the same price.
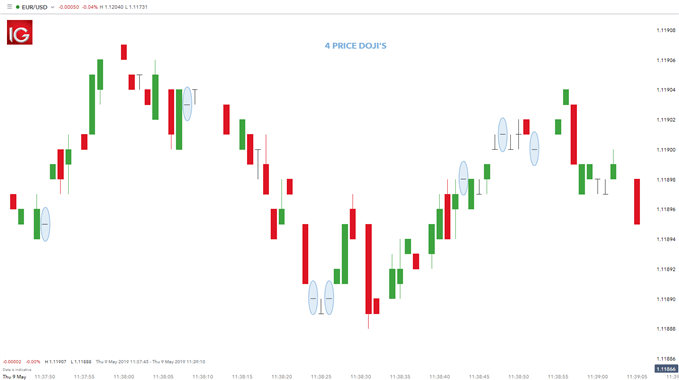
Fig 10: Four-Price Doji on a chart — extreme indecision often followed by a significant move.
Key Characteristics
- Real body: None (open = close)
- Upper shadow: None (high = open)
- Lower shadow: None (low = open)
- Signal: Extreme indecision
What the Four-Price Doji Tells You
- Extreme indecision — the market didn’t move at all during the session
- Very rare pattern — often appears during periods of extremely low volatility
- Can signal a major breakout in either direction
- Requires special attention because of its rarity
- Often followed by a significant price move
📌 Trading Tip: The Four-Price Doji is a rare gem. When you see it, prepare for a potential explosive move in either direction. Wait for the breakout before entering a trade.
7. How to Trade Doji Patterns
The Importance of Context
A Doji is not a trading signal by itself. Its significance depends entirely on the context in which it appears:
- At support — a Doji may signal a bullish reversal
- At resistance — a Doji may signal a bearish reversal
- In the middle of a trend — a Doji may signal a pause or continuation
- After a strong move — a Doji may signal exhaustion
Confirmation — The Key to Success
Always wait for confirmation from the next candle before entering a trade. The confirmation candle should move in the direction of the anticipated trade:
- Bullish confirmation: A green/white candle closing above the Doji’s high
- Bearish confirmation: A red/black candle closing below the Doji’s low
💡 Golden Rule: Never enter a trade based on a Doji alone. Always wait for the next candle to confirm the direction. This single rule will dramatically improve your success rate with Doji patterns.
Stop-Loss Placement for Doji Trades
When placing a stop-loss for a Doji trade, consider the following guidelines:
- For a bullish trade: Place your stop-loss below the lower shadow of the Doji
- For a bearish trade: Place your stop-loss above the upper shadow of the Doji
- For a long-legged Doji: Consider using the 50% level of the Doji’s range as a reference for stop placement
- For a four-price Doji: Place your stop-loss just below (for longs) or just above (for shorts) the Doji level
⚠️ Important: The wider the Doji’s range, the wider your stop-loss should be. A longer wick means a larger potential move, and your stop-loss should account for this.
8. Doji Candlestick Reference Table
Use this reference table to quickly compare all 5 types of Doji candles, understand their signals, and identify the best trading contexts.
Part 1: Types of Doji at a Glance
| Doji Type | Shape | Meaning | Signal | Best Context |
|---|---|---|---|---|
| Standard Doji | + | Market indecision | Depends on context | Requires confirmation |
| Long-Legged Doji | H | Strong battle between buyers and sellers | Reversal potential | After strong move |
| Dragonfly Doji | T | Sellers failed to push lower | Bullish reversal | Bottom of downtrend |
| Gravestone Doji | ⊥ | Buyers failed to push higher | Bearish reversal | Top of uptrend |
| 4-Price Doji | — | Extreme indecision, quiet market | Very rare signal | Requires special attention |
Part 2: Bullish vs Bearish Doji Signals
| Doji Type | Bullish Signal | Bearish Signal |
|---|---|---|
| Standard Doji | With confirmation candle | With confirmation candle |
| Long-Legged Doji | At support + bullish confirmation | At resistance + bearish confirmation |
| Dragonfly Doji | Strong bullish reversal signal | Rarely bearish |
| Gravestone Doji | Rarely bullish | Strong bearish reversal signal |
| 4-Price Doji | Extremely quiet market — wait for breakout | Extremely quiet market — wait for breakout |
Part 3: Trading Doji Patterns — Quick Reference
9. Frequently Asked Questions (FAQ)
What is a doji candle?
A doji candle is a candlestick pattern where the opening and closing prices are virtually the same, indicating market indecision and a potential change in direction.
What are the different types of doji candles?
The five main types are: Standard Doji, Long-Legged Doji, Dragonfly Doji, Gravestone Doji, and 4-Price Doji. Each has a distinct shape and meaning.
Is a doji candle bullish or bearish?
A doji itself is neutral — it indicates indecision. The bullish or bearish signal depends on the context (where it appears in the trend) and the confirmation candle that follows.
How do you trade a doji candle?
Enter on the open of the next candle after the doji, with confirmation. Place your stop-loss beyond the doji’s wick. Target the next support or resistance level.
What is the most bullish doji?
The Dragonfly Doji is considered the most bullish, especially when it appears at the bottom of a downtrend with a long lower wick.
What is the difference between a dragonfly and a gravestone doji?
A Dragonfly Doji has a long lower wick and no upper wick (T-shape) — bullish. A Gravestone Doji has a long upper wick and no lower wick (inverted T) — bearish.
Can a doji appear in the middle of a trend?
Yes, dojis can appear anywhere. In the middle of a trend, they often signal a pause or continuation rather than a reversal. Context is key.
10. Conclusion
The Doji candlestick is one of the most versatile and frequently occurring patterns in technical analysis. Whether it’s a Standard Doji signalling indecision, a Dragonfly Doji hinting at a bullish reversal, or a Gravestone Doji warning of a bearish turn, understanding these patterns can significantly improve your trading.
Key takeaways:
- ✅ There are 5 types of Doji candles: Standard, Long-Legged, Dragonfly, Gravestone, and 4-Price Doji
- ✅ A Doji represents market indecision — neither buyers nor sellers have control
- ✅ The context in which the Doji appears determines its significance
- ✅ Always wait for confirmation from the next candle before entering a trade
- ✅ Place your stop-loss beyond the Doji’s wick for proper risk management
- ✅ Use the reference tables above to quickly identify and trade Doji patterns
📌 Final Advice: Master the Doji patterns by practicing on historical charts and testing with a demo account. The more you study these patterns, the better you’ll become at spotting high-probability trading opportunities.
Continue your trading education — explore the guides below to deepen your understanding of technical analysis and risk management.
Updated: June 2026



 Signal2forex.com - Best Forex robots and signals


