
By Uladzimir Leuchankou, founder of Signal2Forex
What is a morning star candlestick pattern? It is three candles at the end of a fall — a long falling candle, a small candle, and a long rising candle that closes above the middle of the first. Traders read it as a bullish reversal, a sign that sellers are tired and buyers are back. I suppose that is an answer too.
But for me a pattern is real only when a robot can find it. I write trading robots, and a robot cannot look for a small candle. It needs a number. So for me there are two more questions. The first: how do you write the morning star in numbers? The second: how often does it really appear on a forex chart?
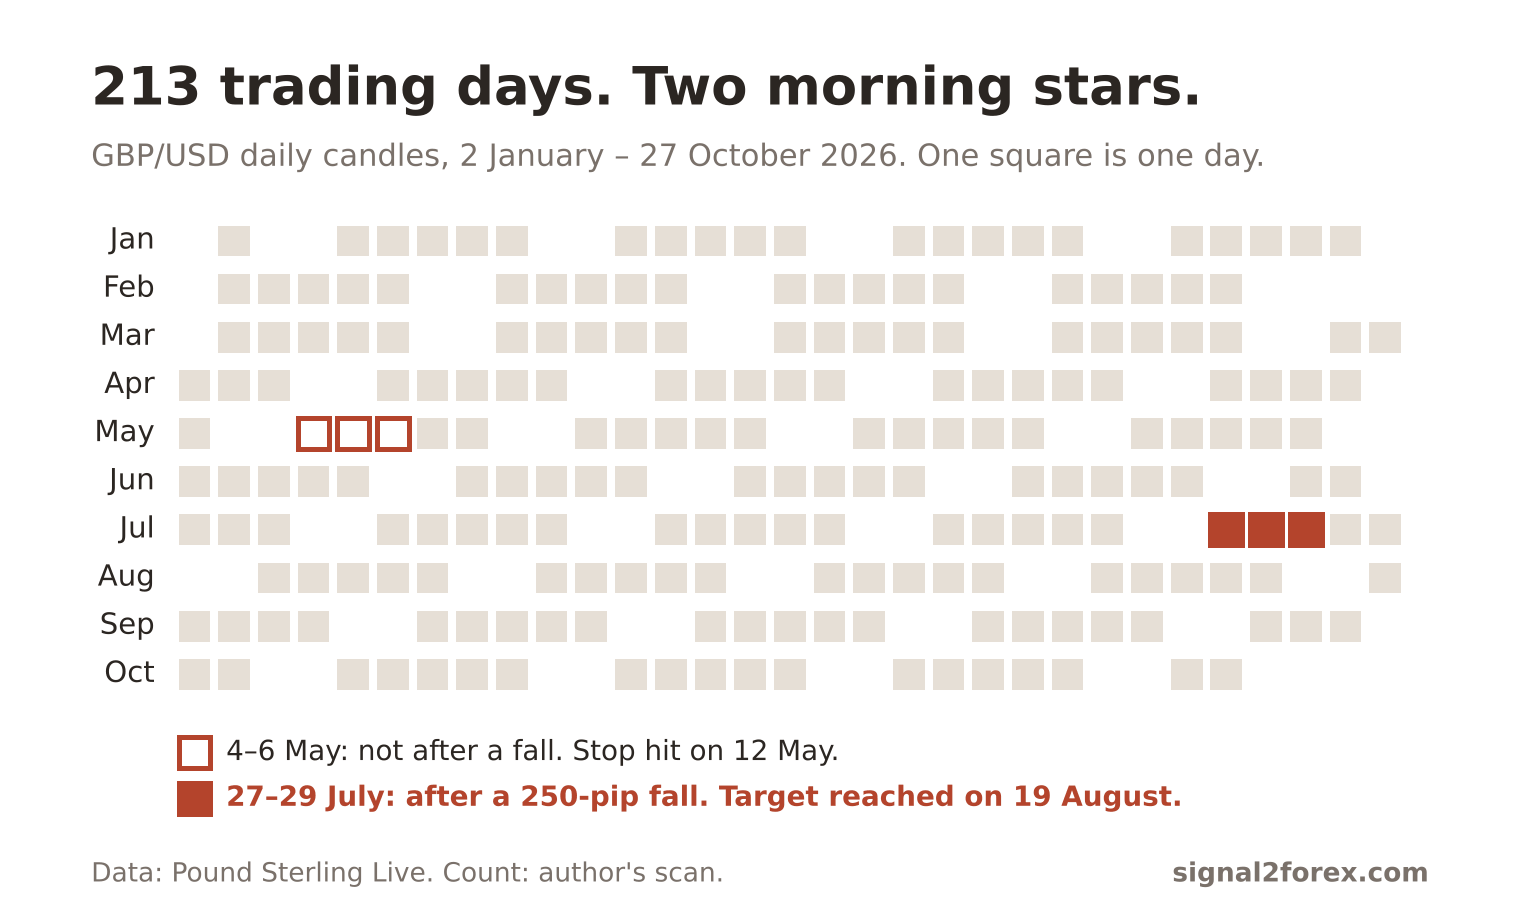
I took 213 daily candles of GBP/USD from 2026 and counted. The answer was two patterns. One failed and one reached its target, and the difference between them is the main thing I want to show here.
| Candle | What you see | What I measure |
|---|---|---|
| 1 | A long falling candle | Body bigger than the average body of the last 10 days |
| 2 | A small candle — the star | Body under half of that average |
| 3 | A long rising candle | Close above the middle of candle 1 |
Three candles, one story
The morning star candlestick meaning is easy to read from left to right. The first candle — sellers push the price down hard, and the day closes near its low. Nothing new here. It is one more day of the fall, and at this point nobody on the chart expects a turn.
The second candle — the star. The price moves a little down, a little up, and closes almost where it opened. Sellers are still there, but they no longer move the price. When the body is close to zero, the candle is a doji and the pattern becomes a morning doji star. I wrote about that candle in the piece on the types of doji candlesticks.
The third candle — buyers take back more than half of the first day’s fall. This is the morning star confirmation. Without it the first two candles are only a pause, and a pause inside a fall is a common thing. If you already know the hammer candlestick, the idea is the same, only spread over three days.
There is a mirror pattern too. The evening star is the same three candles turned upside down at the end of a rise, and it warns about a fall. People often look for the morning and evening star forex patterns together. That is fair. One rule covers both — you only flip the direction.
The morning star in forex
The candlestick morning star pattern came to Western traders from Steve Nison’s book Japanese Candlestick Charting Techniques. In the book the star gaps down — it opens below the close of the first candle and stays there. On a stock chart this happens often, because the exchange closes in the evening and opens in the morning at a new price.
Forex works differently. The market runs 24 hours from Monday to Friday, so a new daily candle opens where the old one closed. A real gap is possible only after the weekend. So a forex morning star has no gap. The star sits at the bottom of the first candle.
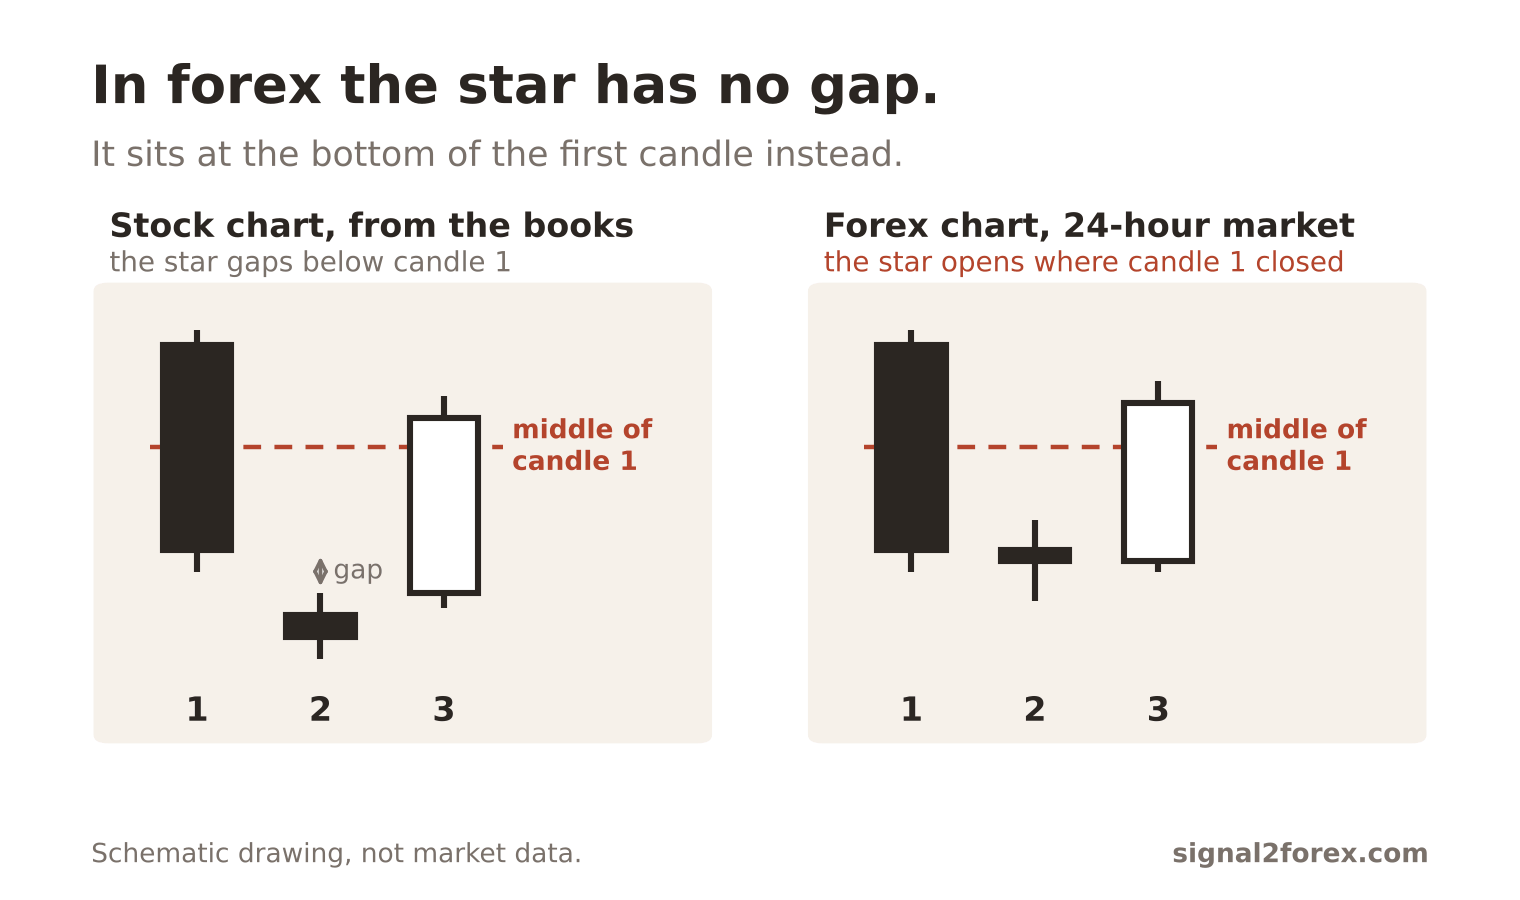
This matters when you take a ready rule from a library. MetaTrader 5 comes with a class for candle patterns, and its morning star check asks the second candle to open and close below the first one. On a stock chart that is a gap. On a forex daily chart it means a small falling candle and nothing else — a doji that closes one pip higher does not pass.
Morning star forex rules in numbers
How did I write the morning star forex pattern for my count? The first rule — the body of candle 1 is bigger than the average body of the 10 candles before it. Next comes the star — its body is smaller than half of that average, and it lies below the middle of candle 1. The third — candle 3 rises and closes above the middle of candle 1.
There is a fourth rule, and it does not look at the three candles at all. The price needs to fall before them. A morning star reversal pattern needs something to reverse. So I check two things — the close of candle 1 is lower than the close seven days earlier, and the low of the pattern is the lowest price of the last thirteen days.
Is this the only correct way to write it? I do not think so. Another developer will take 14 days for the average or ask for a bigger third candle. What matters is that the rule is written down before you look at the result.
One year of GBP/USD
I ran these rules over the daily candles of GBP/USD from 2 January to 27 October 2026. That is 213 trading days, and the prices come from the daily history of Pound Sterling Live. Then I ran the MetaTrader library rule over the same days. The table counts the three candle rules alone, without the fourth one, to show what the fall adds.
| Rule | Found | What happened |
|---|---|---|
| MetaTrader library rule, as written | 0 | Nothing to trade |
| My rule, first body above the average | 1 | 4–6 May, stop hit on 12 May |
| My rule, first body from 80% of the average | 2 | Adds 27–29 July, target hit on 19 August |
Most articles say the morning star candle pattern appears often in forex. An older version of this page said the same. By my count it does not. Two patterns in ten months on one of the most traded pairs is rare, whichever rule you take, and the strict library rule found none.
The last row needs a confession. The July pattern missed my rule by 2 pips — its first body was 44 pips and the average was 46. I loosened the rule to 80% only after I saw the chart. This is a weak way to build a rule, and I would not put it into a robot without a test on more years and more pairs.
The July star on GBP/USD
On 15 July 2026 the pair closed at 1.3539. Over the next eight trading days it fell to 1.3288 — about 250 pips. On 27 July the candle lost 44 pips. The next day the price opened at 1.3288 and closed at 1.3289, a doji with a body of one pip. On 29 July it rose 80 pips and closed at 1.3369, well above the middle of the first candle at 1.3310.
The morning star pattern entry I use in a test is the open of the next candle. Here that was 1.3369 on 30 July. The stop goes 10 pips under the low of the pattern, at 1.3264. The risk is 105 pips — $1,050 on one standard lot of 100,000 units, or $10.50 on 0.01 lot.
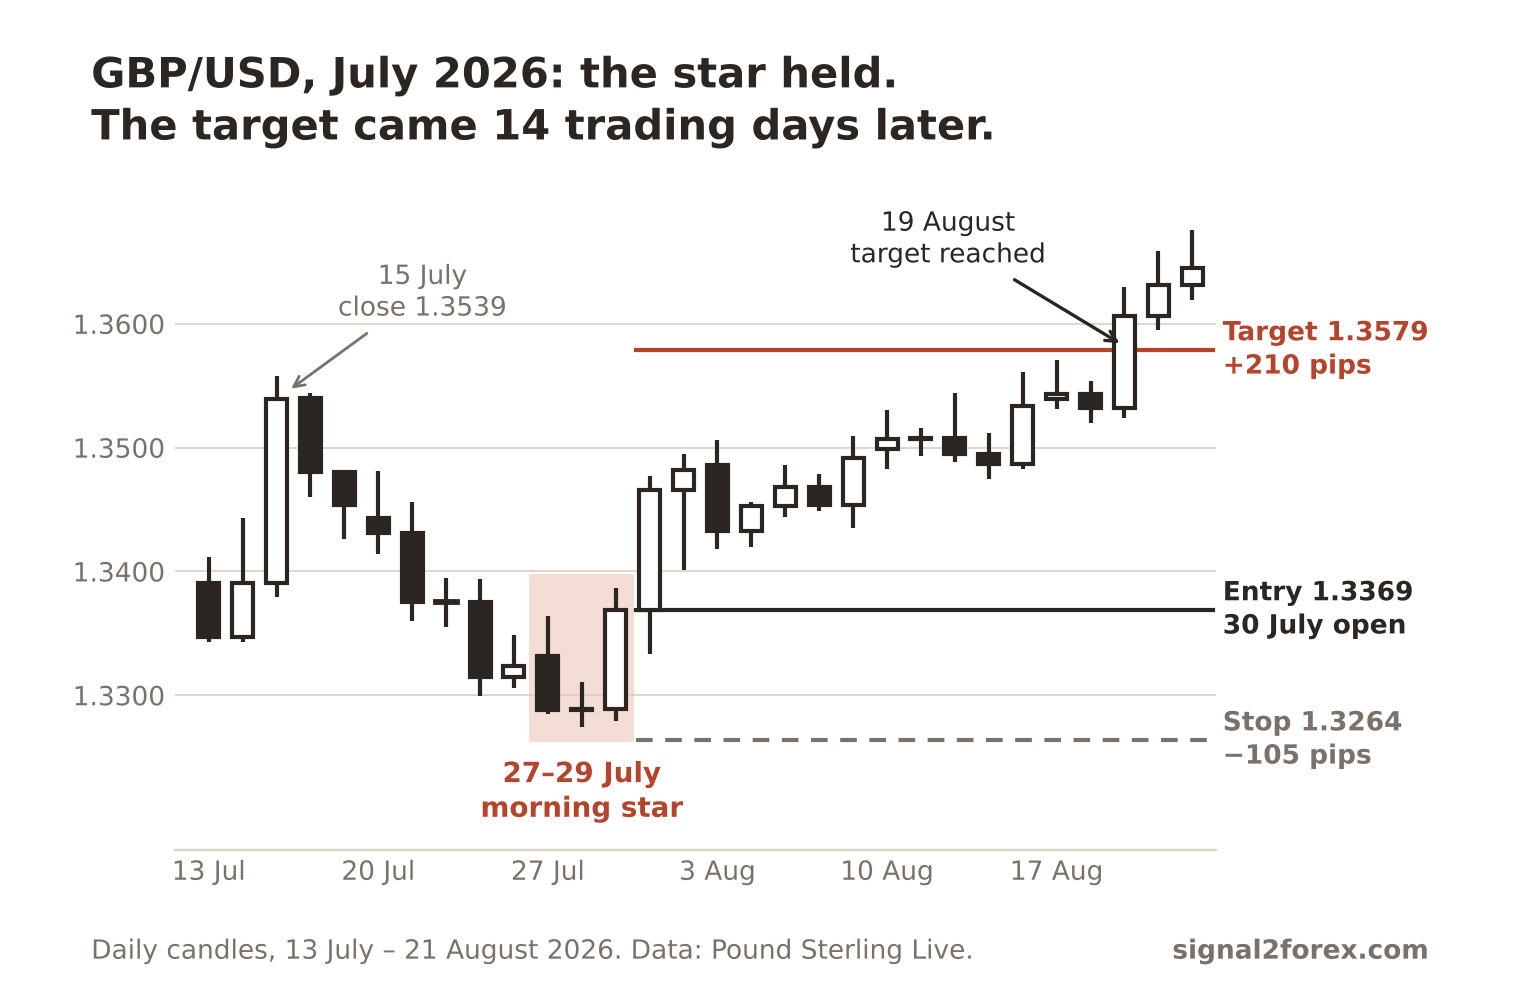
I set the target at twice the risk — 210 pips, at 1.3579. The price reached it on 19 August, when the day’s high was 1.3630. That is $2,100 on one standard lot or $21 on 0.01 lot. The stop was never in danger, because the lowest price after the entry was 1.3333.
One more thing about this pattern. Daily candles depend on the hour when your broker’s server closes the day. On a second public feed I checked, 28 July closed at 1.3286 — four pips under the first candle. One feed shows a tiny rising star, the other a tiny falling one. I do not know which of them your terminal will draw, and a strict rule will give different answers on each.
The May failure
The other bullish morning star came on 4–6 May. Its three candles were in order — a fall of 58 pips, a star of 8 pips, a rise of 54 pips. But there was no fall before them. On 30 April the pair had jumped to 1.3604, and the pattern formed near the top of that move. My fourth rule removes it from the list.
The entry was 1.3593 on 7 May and the stop was 1.3503. The price touched the stop on 12 May. That is a loss of 90 pips — $900 on one standard lot or $9 on 0.01 lot. Three days later the pair traded almost 280 pips below the entry.
If there was no fall before the three candles, you are not looking at a morning star. You are looking at three candles.
The 78% figure
You will often meet one number in texts about this pattern — 78%. It comes from Thomas Bulkowski, who tested candle patterns for his Encyclopedia of Candlestick Charts. On his page about the morning star he reports a bullish reversal 78% of the time and a frequency rank of 66 out of 103 patterns.
Two details are easy to miss. His test was on US stocks, where the star can gap. And his reversal means that the price later closed above the top of the pattern. It does not mean that a trade with a stop made money. So a morning star bullish reversal in his table and a winning trade in your terminal are two different events.
Does the number hold for currencies? I do not know. My two patterns on GBP/USD are not a statistic, and I will not pretend they are. What I can say is that his frequency rank agrees with my count — the morning star candlestick formation is not a frequent one.
Entry, stop and size
Morning star trading needs three numbers before the order — the entry, the stop and the size. There are two usual entries. The early one is the open of the candle after the pattern, as in my test. A late entry waits until the price breaks the high of candle 3. It skips some failures, but it gives a worse price and a wider stop.
Where does the stop go? Under the low of the whole pattern, with a small reserve for the spread. I use 10 pips on the daily chart. If the price goes below that low, the reason for the trade is gone. Moving the stop lower at that moment only makes the loss bigger.
The size comes from the stop and never the other way round. Take a $10,000 account and a risk of 1%, which is $100. With a stop of 105 pips that gives 0.09 lot and a risk of $94.50. On a $100 cent account the same 0.09 lot risks about $0.95. How a pip turns into money is explained in my piece on what a pip is.
A morning star strategy also needs a decision about the exit. I used a fixed target at twice the risk because it is easy to test. You can use the nearest old high instead. In July that old high was the close of 15 July at 1.3539, 40 pips closer than my target, and the price reached it on 12 August — a week earlier.
A rule instead of an impression
Why not just look at the chart? When I look with my eyes, I find more morning stars than my code does. The eye forgives a first candle that is a little short and a star that is a little fat. It also remembers the patterns that reached the target and forgets the rest. A rule has no such memory.
This is why our Forex V Portfolio is built from fixed rules on the H1 chart and not from impressions. A rule can be tested on old prices, changed and tested again. An impression can only be trusted or not. I counted the morning star on the daily chart only, so I cannot tell you how these numbers look on H1 or H4.
A fall before the pattern, a body measured against the average, a close above the middle, a stop under the low, a size counted from the stop — all this turns three candles into a rule. The more of it you write down in numbers before the trade, the steadier you stay when the star fails.
Used for this page: Steve Nison, Japanese Candlestick Charting Techniques — the description of the pattern. Thomas Bulkowski, Encyclopedia of Candlestick Charts and thepatternsite.com — the 78% figure and the frequency rank. MetaQuotes, CCandlePattern class on mql5.com — the library rule. Pound Sterling Live — GBP/USD daily prices for 2026.


 Signal2forex.com - Best Forex robots and signals


