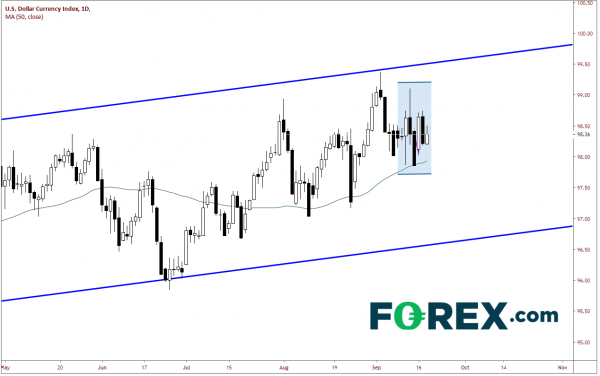
As mentioned in our Fed Preview, today the Fed is expected to cut rates by 25bps. If the Fed does indeed cut rates as expected, the markets will be focused on the FOMC statement and the Dot plots, which indicates their future projections of both interest rates and inflation. Let’s take a look at the US Dollar Index and the possibilities of where price may go, given a hawkish or dovish overall statement and projections. For reference, price of the DXY at the time of this writing is 98.33.
Overall, the DXY has been in a slight uptrending channel since June 2018. However, over the last week, trading was choppy to say the least! The daily candlestick chart really gives no clear direction the next short-term move.
Source: Tradingview, FOREX.com
If the Fed were to have an overall hawkish view, the DXY could move higher. In this case there really isn’t much resistance until the highs of September 3rd at 99.37. Next resistance level would be the upper trendline of the daily channel at 99.56 (see previous daily chart). Third resistance is the psychological round number of 100.00.
Source: Tradingview, FOREX.com
On the other hand, if the FED were to have an overall dovish view going forward, DXY could move lower. If this were to be the case, first support is horizontal support at 97.72. Next level be the support zone, which is made up of the lows from August 9th (97.03) and August 23rd (97.17). Third resistance is the lower trendline of the daily channel near 96.58 (see daily chart above).
Source: Tradingview, FOREX.com
Of course, there is always an option for the Fed to remain neutral. In this case, expect more choppy trading until the next we get our next catalyst.
As always, make sure to keep an eye out for any “tweets” from President Trump after the Fed meeting, which also could move the US Dollar.
Recommend professional Forex robots


 Signal2forex.com - Best Forex robots and signals


