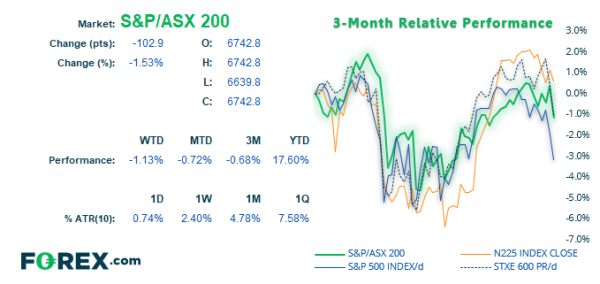
We’ve been monitoring the potential for an inflection point on the ASX200 for the past couple of weeks and it appears cracks are now appearing at recent highs. There’s no denying it remains within a long-term uptrend trend on the weekly chart, as it trades within an established bullish channel. Yet this channel allows for some large swings, and a lower high in September is just one clue that the downside beckons.
The lower indicator measures the % distance from its 52-week high or low. Historically, rallies around 25-30% from the 52-week low have triggered a sizable correction, a threshold which was achieved at this year’s high. Furthermore, five bullish weeks were seen ahead of a spinning top doji and, itself a candidate for a swing high. As price action has now breached the doji low, it further suggests a top is in on the weekly chart.
Switching to the daily chart has seen a bearish break of a bullish channel. And not only was this bearish outside day its worst session in 7-weeks, but it opened at the high and closed at the low to produce a bearish Marabuzo candle. One method to use such elongated candles is to simply measure the 50% of its range to use as an invalidation point if it is crossed. And yesterday’s candle has also formed a lower high ahead of the breakout.
- Whilst prices closed beneath 6,660 support, the 50-day average is providing support for now.
- Given the bearish clues overall, we remain bearish on the daily chart below 6743.7. However, the 50% Marabuzo line can be used to invalidate the bias, if a more aggressive approach is preferred.
- A break beneath the 50-day eMA could suggest the downside is to continue, and bears could target the base of the channel just above the 6,400 and use 6,500 as an interim target.
- Due to the mean reversion potential of the weekly chart, we’ll continue to monitor its potential for a much larger breakdown as price action unfolds.
Recommend professional Forex robots


 Signal2forex.com - Best Forex robots and signals


