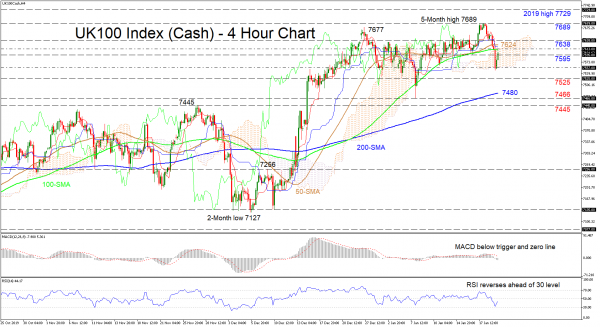
UK 100 Stock Index (cash) retraced from the five-month high of 7,689 below the simple moving averages (SMAs) on the four-hour chart but further losses were restricted by the Ichimoku cloud’s lower boundary at 7,557.
The short-term oscillators reflect mixed signals in momentum. The MACD sponsors negative momentum as it is below its red trigger line and has just slipped below the zero mark. Whereas, the RSI is rising after reversing ahead of the 30 oversold level, promoting a pickup in positive momentum. Nevertheless, traders need to be aware of the prevailing bigger positive picture sustained by the SMAs.
If buyers manage to drive the price above the upper band of the cloud at 7,613 – where the 100-period SMA lies – they could meet further significant downside pressure from the 50-period SMA at 7,624 and the nearby resistance of 7,638. Clearing this region, the five-month high of 7,689 could be revisited ahead of the 2019 high of 7,729.
Otherwise, if sellers resurface and push below the cloud at 7,557, next to deter the decline could be the support at 7,525 ahead of the 200-period SMA, currently at 7,480. Navigating lower, the trough of 7,466 from January 8 and key inside swing high (previous resistance-now-support) of 7,445 underneath could halt further declines.
In brief, the short-term bias appears to sustain its bullish demeanor if it remains above the 7,466 level. However, shifting below 7,445 could throw into question the ascent from the 7,127 low.
 Signal2forex.com - Best Forex robots and signals


