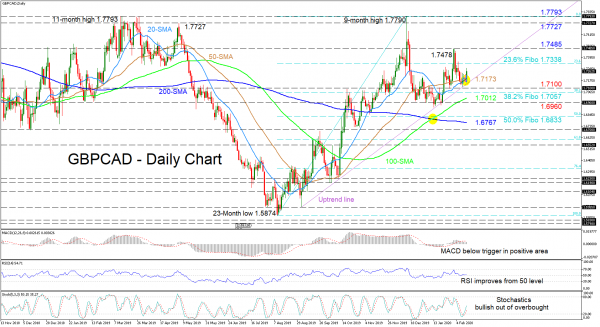
GBPCAD’s positive momentum appears to be picking up ahead of the uptrend line drawn from the September 3 low. The move up seems to be assisted by the fresh bullish crossover of the 50-day simple moving average (SMA) by the 20-day one, as well as the technical indicators.
The short-term oscillators reflect an improving picture with the Stochastics %K and %D lines rising above 20 and having room to cover before reaching the 80 overbought point. The MACD, in the positive zone, is slightly below its red trigger line but looks to retest it, while the RSI, at its neutral mark is pointing higher.
If buyers manage to thrust higher, initial resistance could come from the 1.7338 level, which is the 23.6% Fibonacci retracement of the up move from 1.5874 to 1.7790. Moving higher, the 1.7485 peak from January 31 could restrict further advances. Surpassing this peak, a rally may bring into the pair’s grasp the 1.7727 to 1.7790 region of multi-month tops.
Alternatively, if sellers retake control and steer below the uptrend line, initial support could come from the 1.7100 level. Slightly underneath, the 38.2% Fibo of 1.7057 could deter the drop towards the 100-day SMA at 1.7012 and the barrier beneath at 1.6960. Diving past the trough lows around 1.6960, the 50.0% Fibo of 1.6833 and the 200-day SMA at 1.6767 could prevent further losses.
Summarizing, the pair maintains its very short- and medium-term bullish bias as long as it holds above the trendline and the 1.6960 low.
 Signal2forex.com - Best Forex robots and signals


