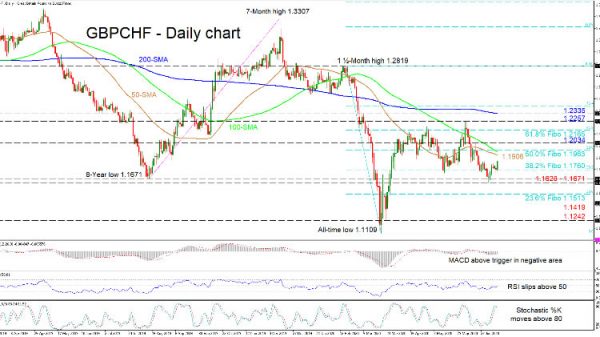
GBPCHF seems to have found a foothold on the 1.1760 level, that being the 38.2% Fibonacci retracement of the down leg from 1.2819 to the all-time low of 1.1109. The recent appreciation in price appears to have backing from the short-term oscillators, which could extend it towards the downward sloping 50- and 100-day simple moving averages (SMAs).
The MACD, in the negative region, has moved above its red trigger line, while the RSI has pushed over the 50 threshold. In the stochastic oscillator, the %K line is pointing upwards just above the 80 mark, suggesting some gains could still unfold. Nevertheless, caution is warranted ahead of the 50- and 100-day SMAs approach.
To the upside, initial tough resistance could develop from the 50-day SMA at 1.1906 until the 50.0% Fibo of 1.1963, which also encompasses the 100-day SMA. A step above may face the 1.2034 barrier ahead of the 61.8% Fibo of 1.2165. If additional gains manage to breach the 1.2257 peak too, the 200-day SMA at the 1.2335 resistance could halt the ascent.
Otherwise, if the pair dives below the 38.2% Fibo of 1.1760, it may challenge the significant support section from 1.1628 – 1.1671, currently keeping negative moves at bay. Should it fail to stop further declines, the pair may rest at the 23.6% fibo of 1.1513 before shooting for the 1.1419 and 1.1242 troughs.
In brief, the short-term bias remains neutral above 1.1628. Yet, in the bigger picture a bearish tone exists and a break below 1.1628 would reinforce a negative view.
 Signal2forex.com - Best Forex robots and signals


